Fig. 5
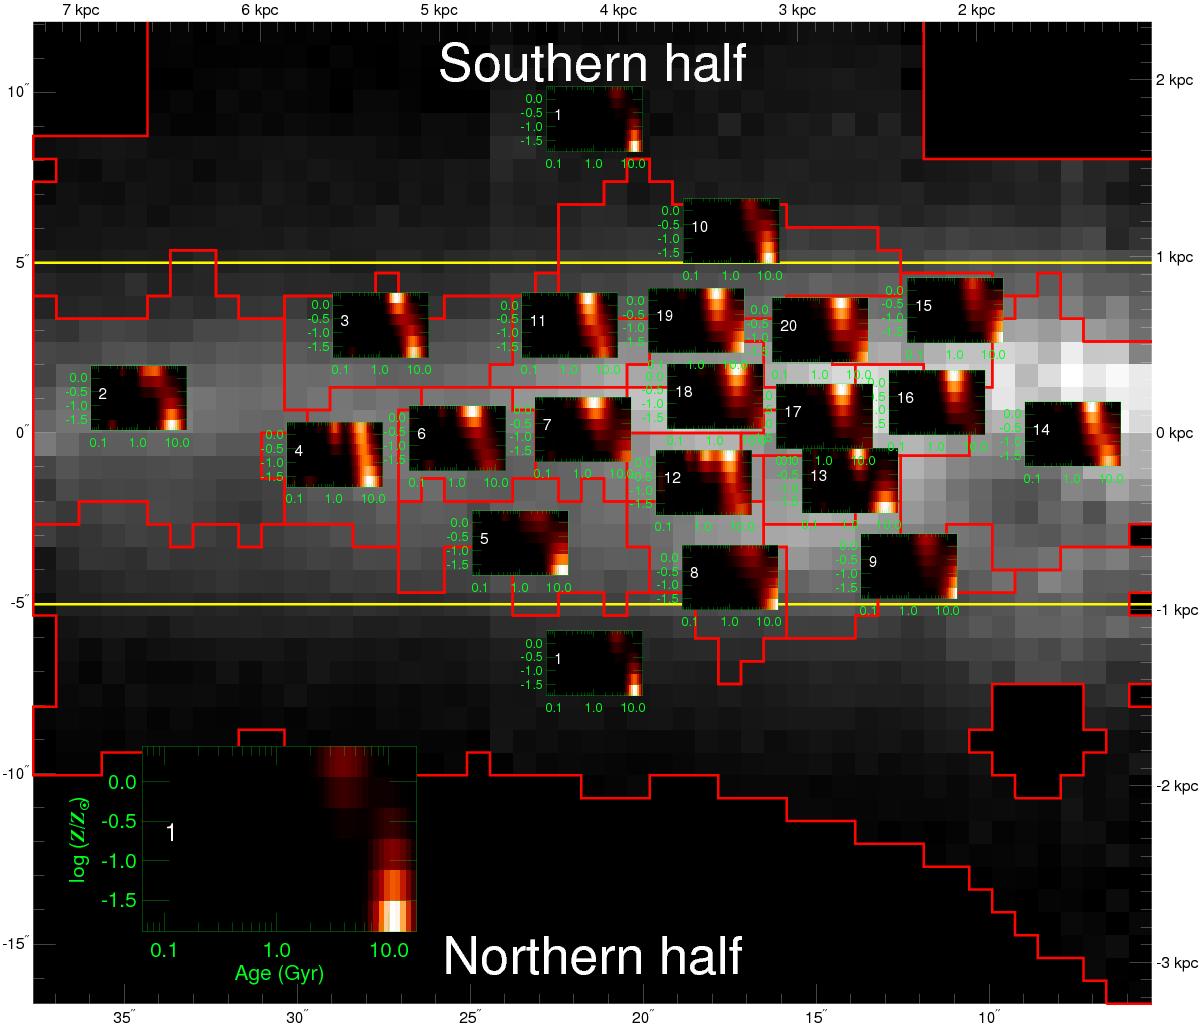
Stellar populations of ESO 533-4. The background image is the same as in the middle panel of Fig. 3. The red lines indicate the spacial bins used for the analysis. The horizontal solid yellow lines indicate the height above which 90% of the light comes from the thick disc. On top of each bin there is a stellar population plot with the horizontal axis corresponding to the ages in Gyr and the vertical axis corresponding to the metallicities in log (Z/Z⊙). The two thick disc sections (uppermost and lowermost tiles) were actually treated as a single bin. The colours in the plots for each bin indicate the mass fraction of a given stellar population. The bottom left corner of the figure shows an enlarged version of one of the stellar population distributions to improve the readability of the axes.
Current usage metrics show cumulative count of Article Views (full-text article views including HTML views, PDF and ePub downloads, according to the available data) and Abstracts Views on Vision4Press platform.
Data correspond to usage on the plateform after 2015. The current usage metrics is available 48-96 hours after online publication and is updated daily on week days.
Initial download of the metrics may take a while.