Free Access
Fig. 4
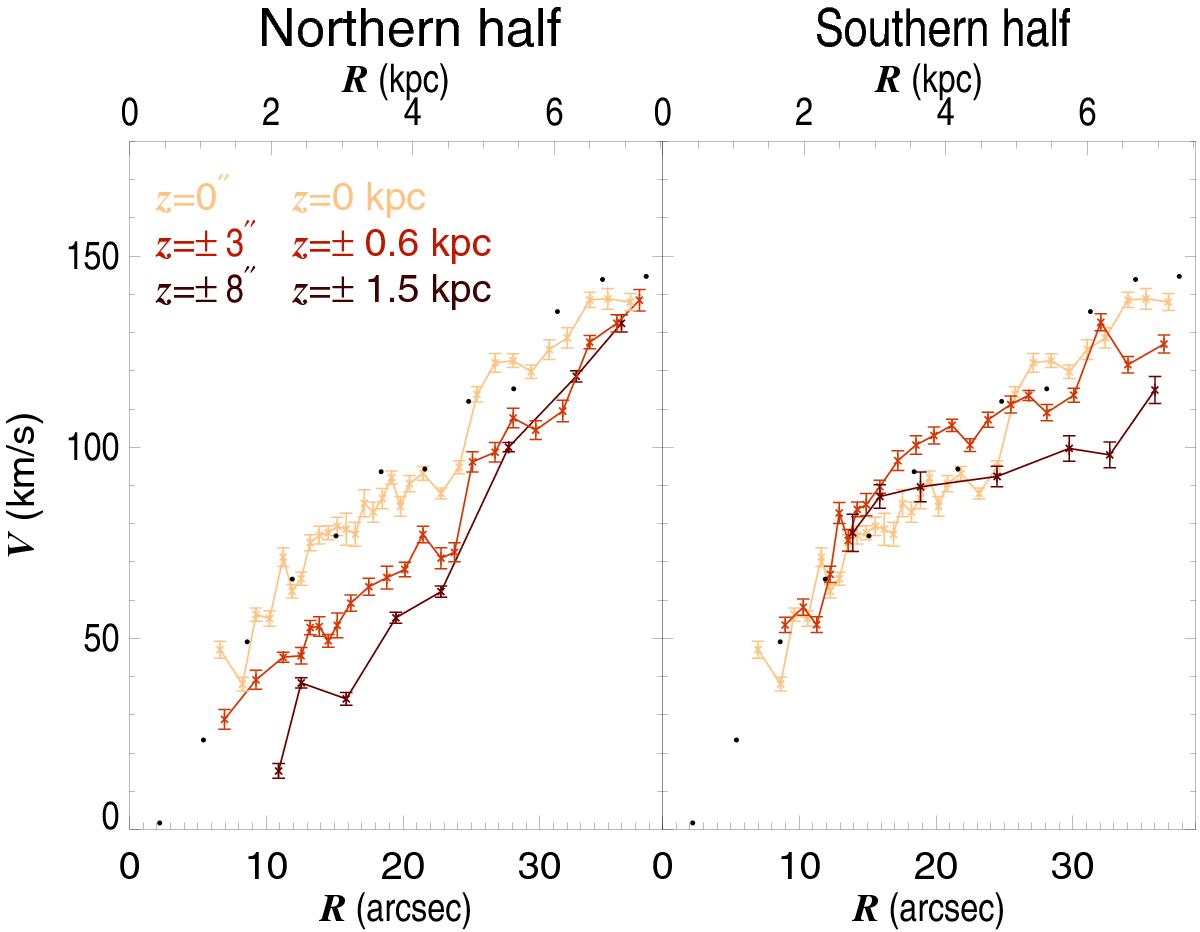
Rotation curves of ESO 533-4 at different heights as indicated by the colours. The northern half of the disc corresponds to the bottom half of the disc in Fig. 3. The black dots correspond to the Mathewson et al. (1992) Hα rotation curve with a + 10 km s-1 offset (see text).
Current usage metrics show cumulative count of Article Views (full-text article views including HTML views, PDF and ePub downloads, according to the available data) and Abstracts Views on Vision4Press platform.
Data correspond to usage on the plateform after 2015. The current usage metrics is available 48-96 hours after online publication and is updated daily on week days.
Initial download of the metrics may take a while.