Fig. 3
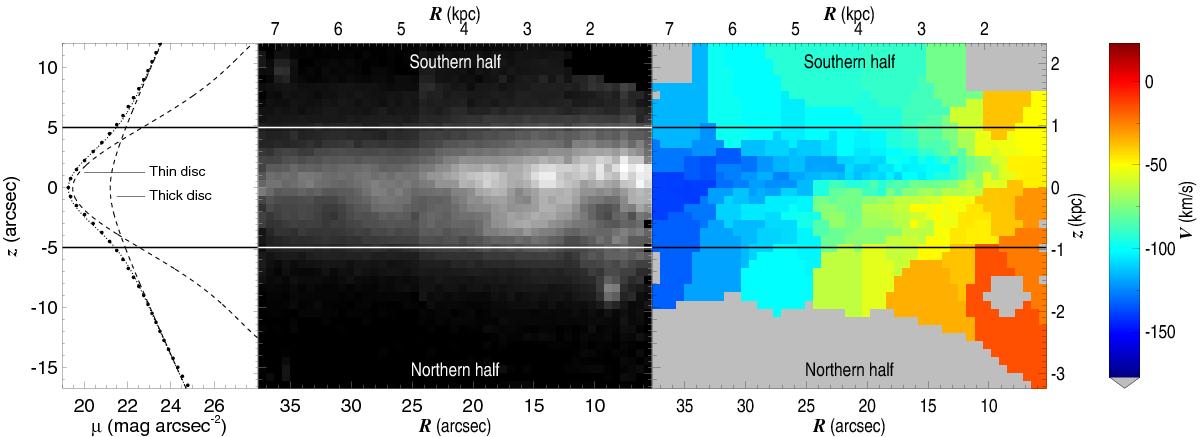
Left panel: symmetrized, mid-infrared S4G luminosity profile and thin/thick disc decomposition of the 0.08 r25–0.69 r25 (0.8–7.3 kpc) axial range of ESO 533-4 (the one covered by the IFU). The horizontal solid lines indicate the height, zs above which 90% of the light comes from the thick disc. Middle panel: image of the observed field made by collapsing the spectra. Right panel: velocity field of ESO 533-4 after the subtraction of the recession velocity. The horizontal axis indicates the axial distance to the galaxy centre and the vertical axis indicates the distance from the mid-plane.
Current usage metrics show cumulative count of Article Views (full-text article views including HTML views, PDF and ePub downloads, according to the available data) and Abstracts Views on Vision4Press platform.
Data correspond to usage on the plateform after 2015. The current usage metrics is available 48-96 hours after online publication and is updated daily on week days.
Initial download of the metrics may take a while.