Fig. 2
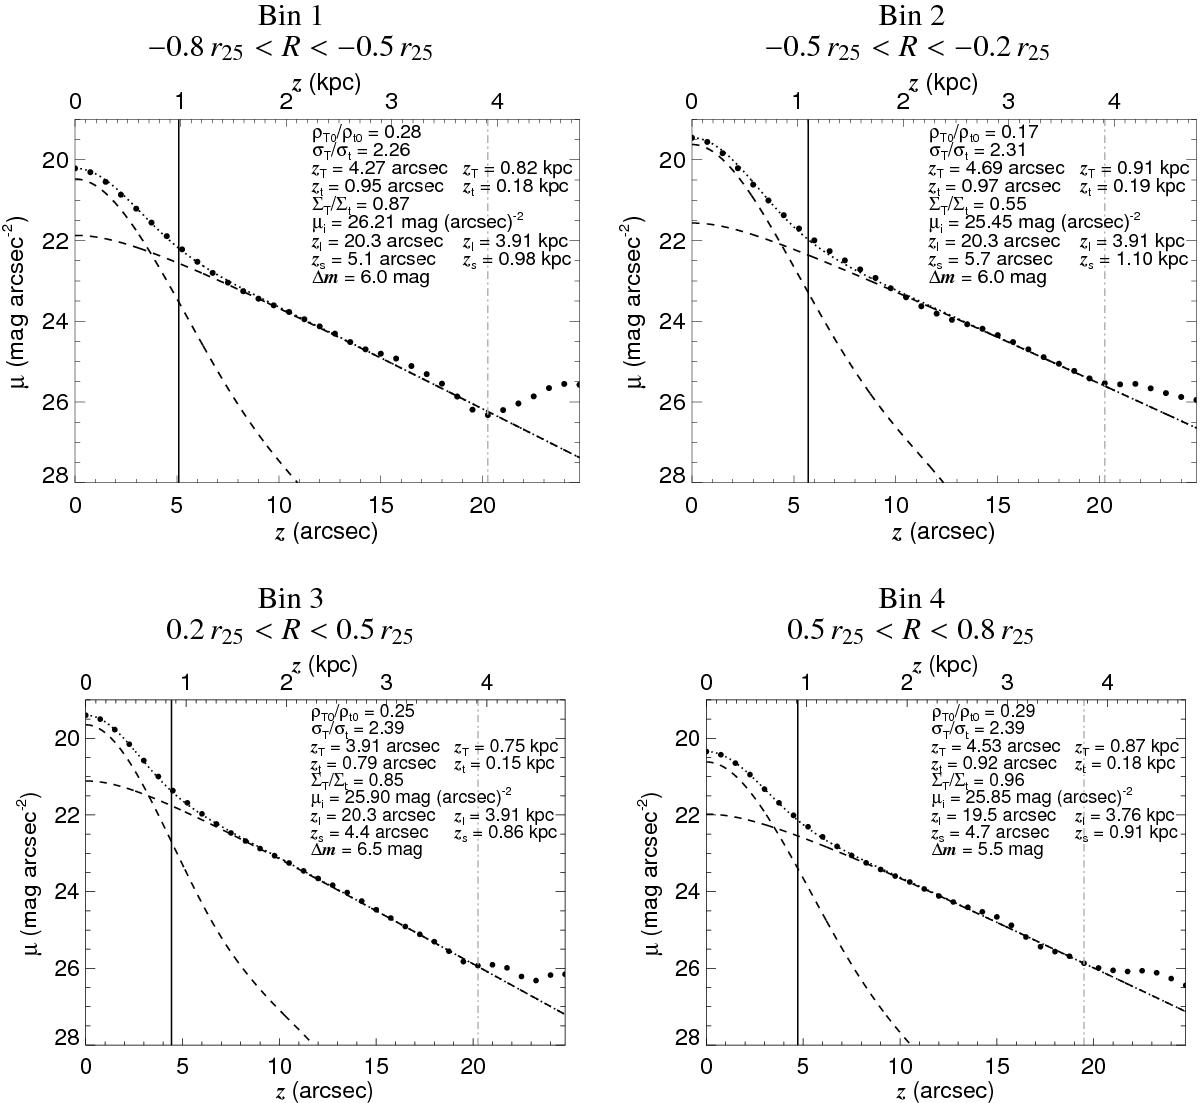
Luminosity profiles of ESO 533-4 in the four bins perpendicular to the mid-plane that are indicated in Fig. 1 (large dots). The fits are indicated with the dotted lines, and the contribution of the thin and thick discs are indicated with dashed lines. The vertical solid line indicates the height, zs, above which 90% of the light comes from the thick disc according to our fit. The dot-dashed grey vertical line indicates the maximum height, zl, that we use for the fit. ρT0/ρt0 stands for the thick to thin disc mass density ratio at the mid-plane, σT/σt for their velocity dispersion ratio, zT and zt for the thick and thin disc vertical scale heights, ΣT/ Σt for the thick to thin disc mass ratio, μi for the lowest fitted surface brightness level, and Δm for the range in magnitudes over which the fit was done.
Current usage metrics show cumulative count of Article Views (full-text article views including HTML views, PDF and ePub downloads, according to the available data) and Abstracts Views on Vision4Press platform.
Data correspond to usage on the plateform after 2015. The current usage metrics is available 48-96 hours after online publication and is updated daily on week days.
Initial download of the metrics may take a while.