Fig. 1
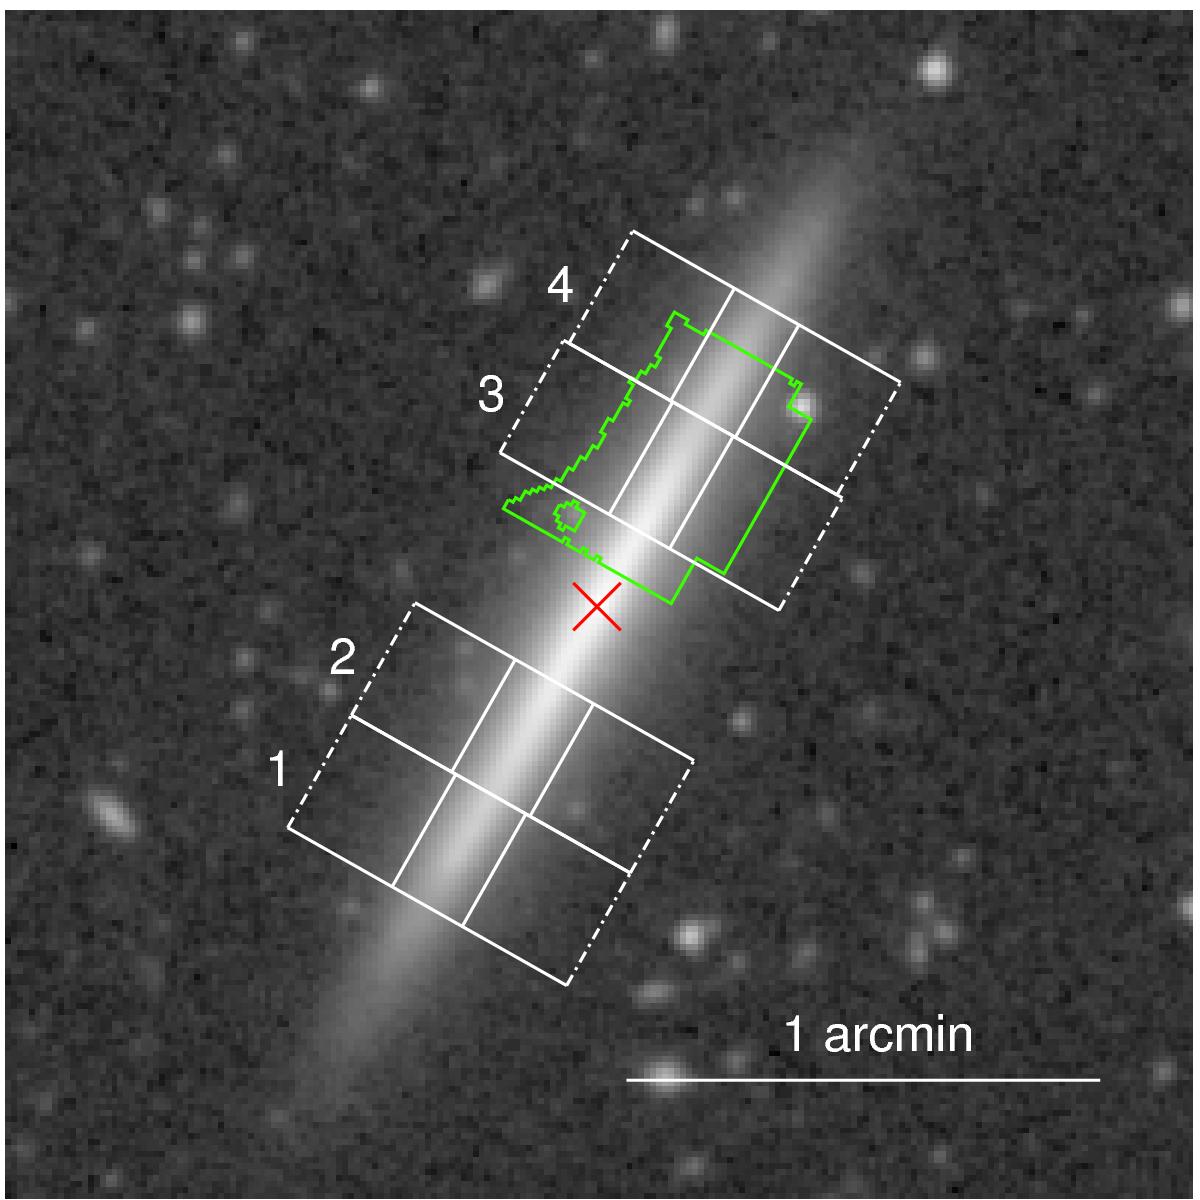
3.6 μm image of ESO 533-4 from the S4G. The red cross indicates the centre of the galaxy and the region with a green border is that we studied. North is up and east is left. The white solid lines perpendicular to the galaxy mid-plane show the four axial bins used for the luminosity profile fits in Fig. 2. The dash-dotted lines indicate the heights over which the profiles were fit. The solid lines parallel to the galaxy mid-plane correspond to the height above which 90% of the light comes from the thick disc. The numbers are used to associate the bins with the fits in Fig. 2.
Current usage metrics show cumulative count of Article Views (full-text article views including HTML views, PDF and ePub downloads, according to the available data) and Abstracts Views on Vision4Press platform.
Data correspond to usage on the plateform after 2015. The current usage metrics is available 48-96 hours after online publication and is updated daily on week days.
Initial download of the metrics may take a while.