Fig. 9
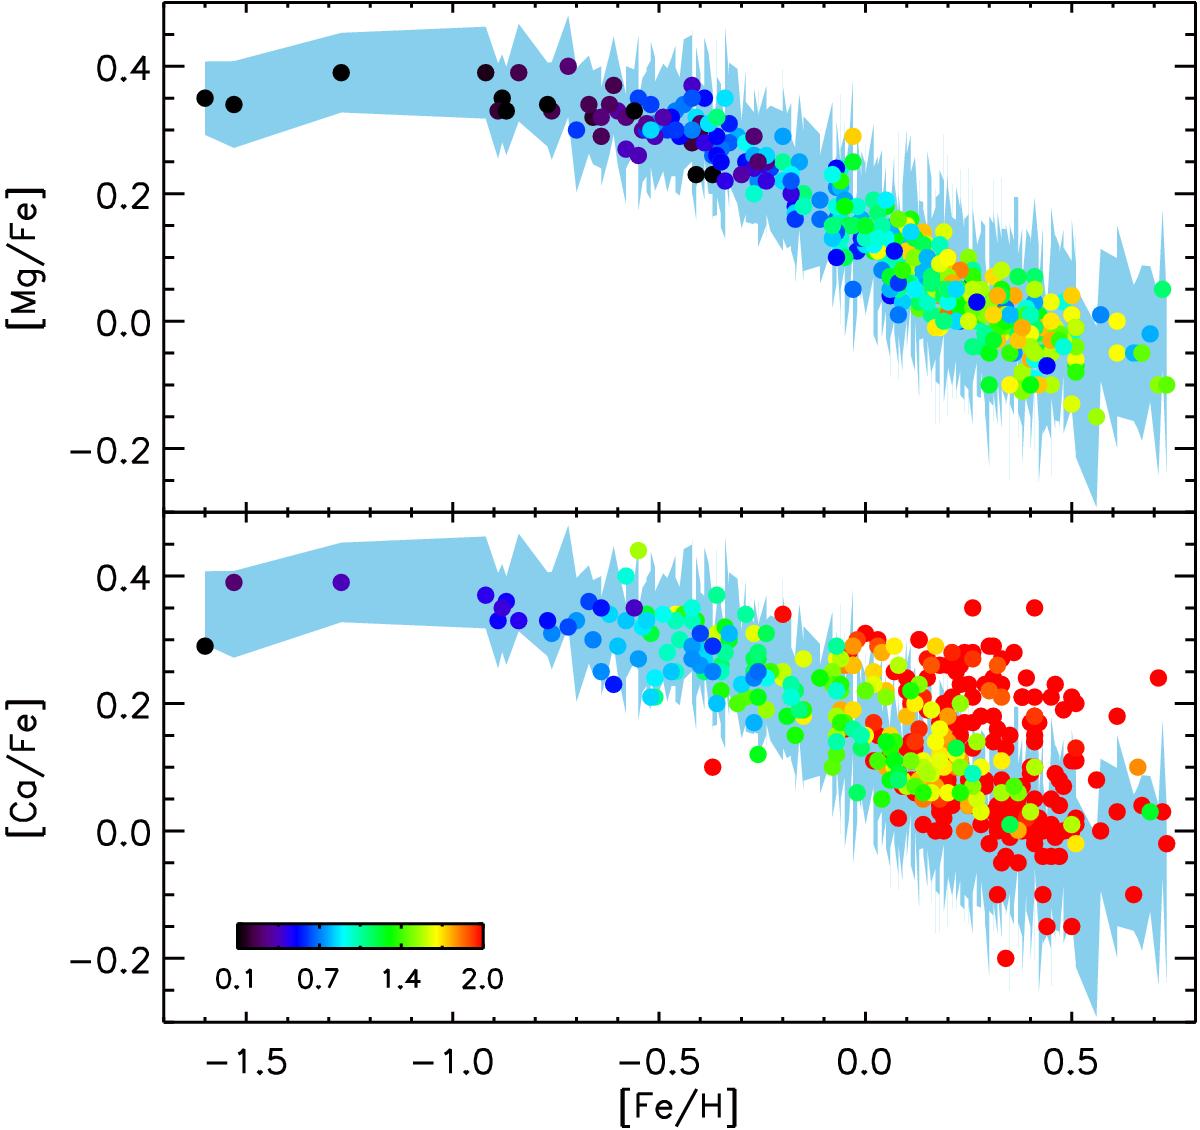
Distribution of [Mg/Fe] (upper panel) and [Ca/Fe] (lower panel) as a function of [Fe/H] as in Fig. 11. Here we colour-coded the abundances of [Ca/Fe] and [Mg/Fe] according to the estimated uncertainty value. The colour-coding was fixed in both panels to the range of [Mg/Fe] uncertainties between 0.07−0.20 dex from black to red. The uncertainty contour of [Mg/Fe] is also shown in the background of both panels as a reference.
Current usage metrics show cumulative count of Article Views (full-text article views including HTML views, PDF and ePub downloads, according to the available data) and Abstracts Views on Vision4Press platform.
Data correspond to usage on the plateform after 2015. The current usage metrics is available 48-96 hours after online publication and is updated daily on week days.
Initial download of the metrics may take a while.