Fig. 8
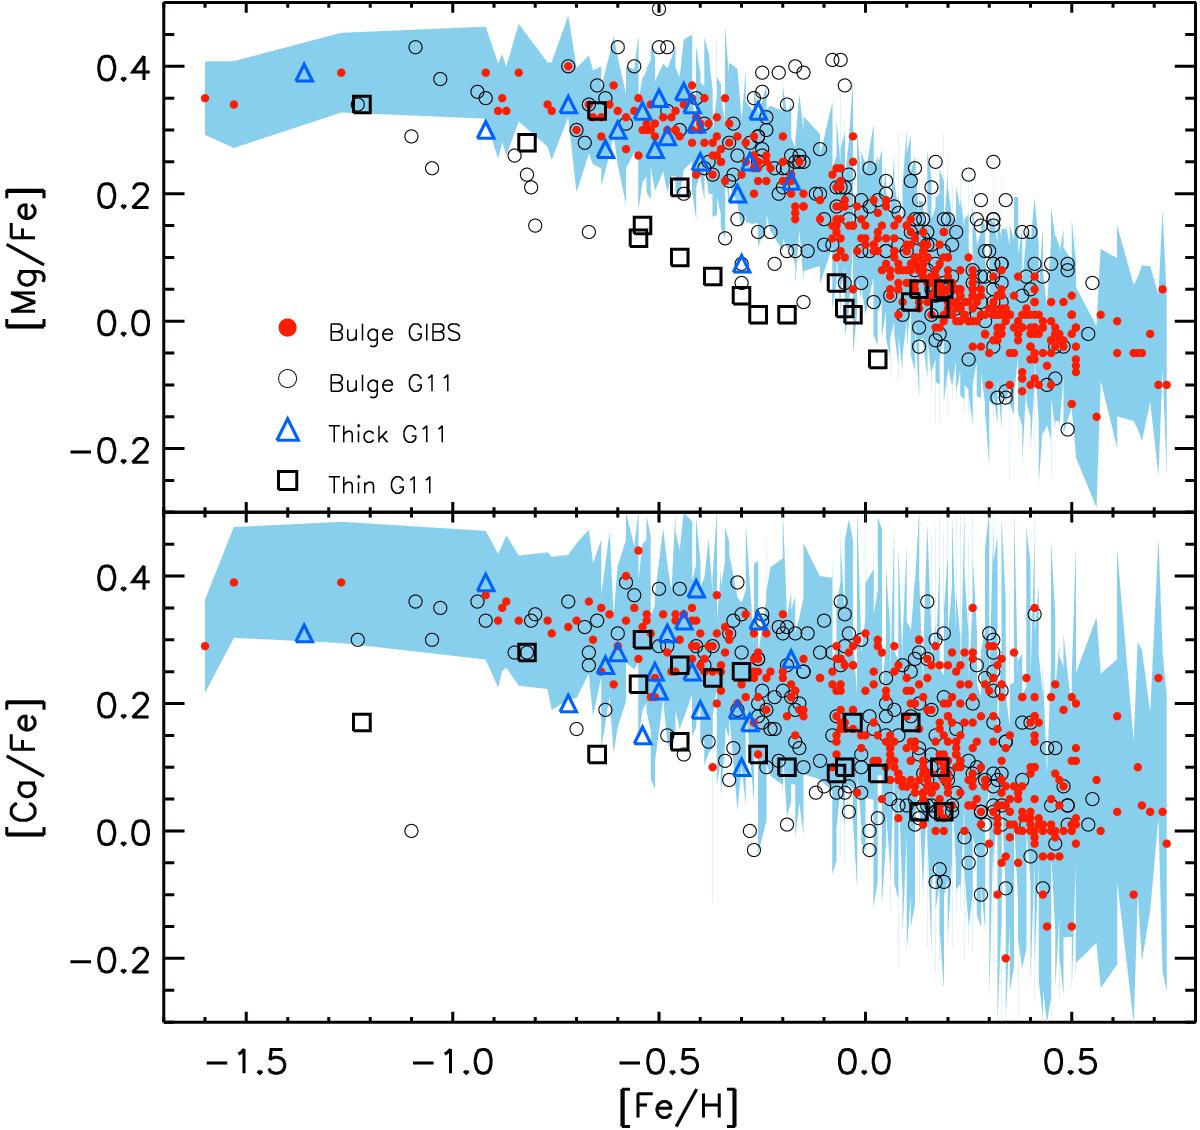
Distribution of [Mg/Fe] (upper panel) and [Ca/Fe] (lower panel) as a function of [Fe/H] used as a diagnostic of the formation timescale of the bulge. Shown as red circles are the [Mg/Fe] and [Ca/Fe] values obtained from the HR13 spectra of 400 stars in the four GIBS fields presented in this work compared to those for RGB stars from the Baade’s window sample of Gonzalez et al. (2011) which are shown as black empty circles. Measurements for the local thin (black squares) and thick (blue triangles) disc stars from the sample from Gonzalez et al. (2011) are also shown in both panels. The uncertainties for [Ca/Fe] and [Mg/Fe] abundances are shown as a light blue contour in both panels according to the individual uncertainties reported in Table 3.
Current usage metrics show cumulative count of Article Views (full-text article views including HTML views, PDF and ePub downloads, according to the available data) and Abstracts Views on Vision4Press platform.
Data correspond to usage on the plateform after 2015. The current usage metrics is available 48-96 hours after online publication and is updated daily on week days.
Initial download of the metrics may take a while.