Fig. 7
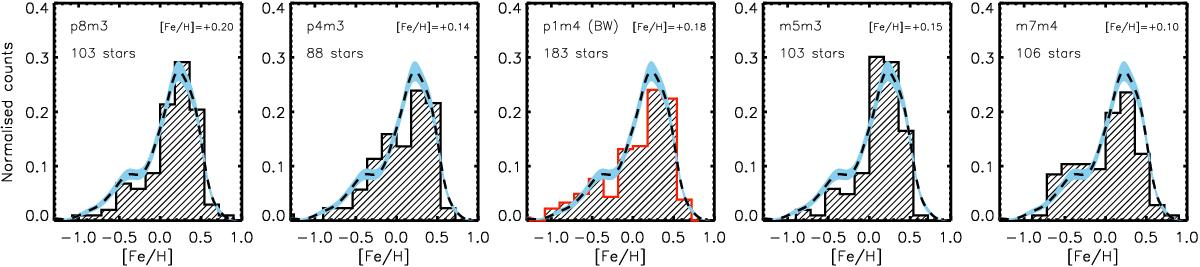
Metallicity distributions for the four GIBS high-resolution fields. Additionally, the metallicity distribution for Baade’s window from Hill et al. (2011) is shown in red in the middle panel. For each of the metallicity distributions we overplot the probability density distribution for the entire sample of metallicities shown in Fig. 6.
Current usage metrics show cumulative count of Article Views (full-text article views including HTML views, PDF and ePub downloads, according to the available data) and Abstracts Views on Vision4Press platform.
Data correspond to usage on the plateform after 2015. The current usage metrics is available 48-96 hours after online publication and is updated daily on week days.
Initial download of the metrics may take a while.