Fig. 6
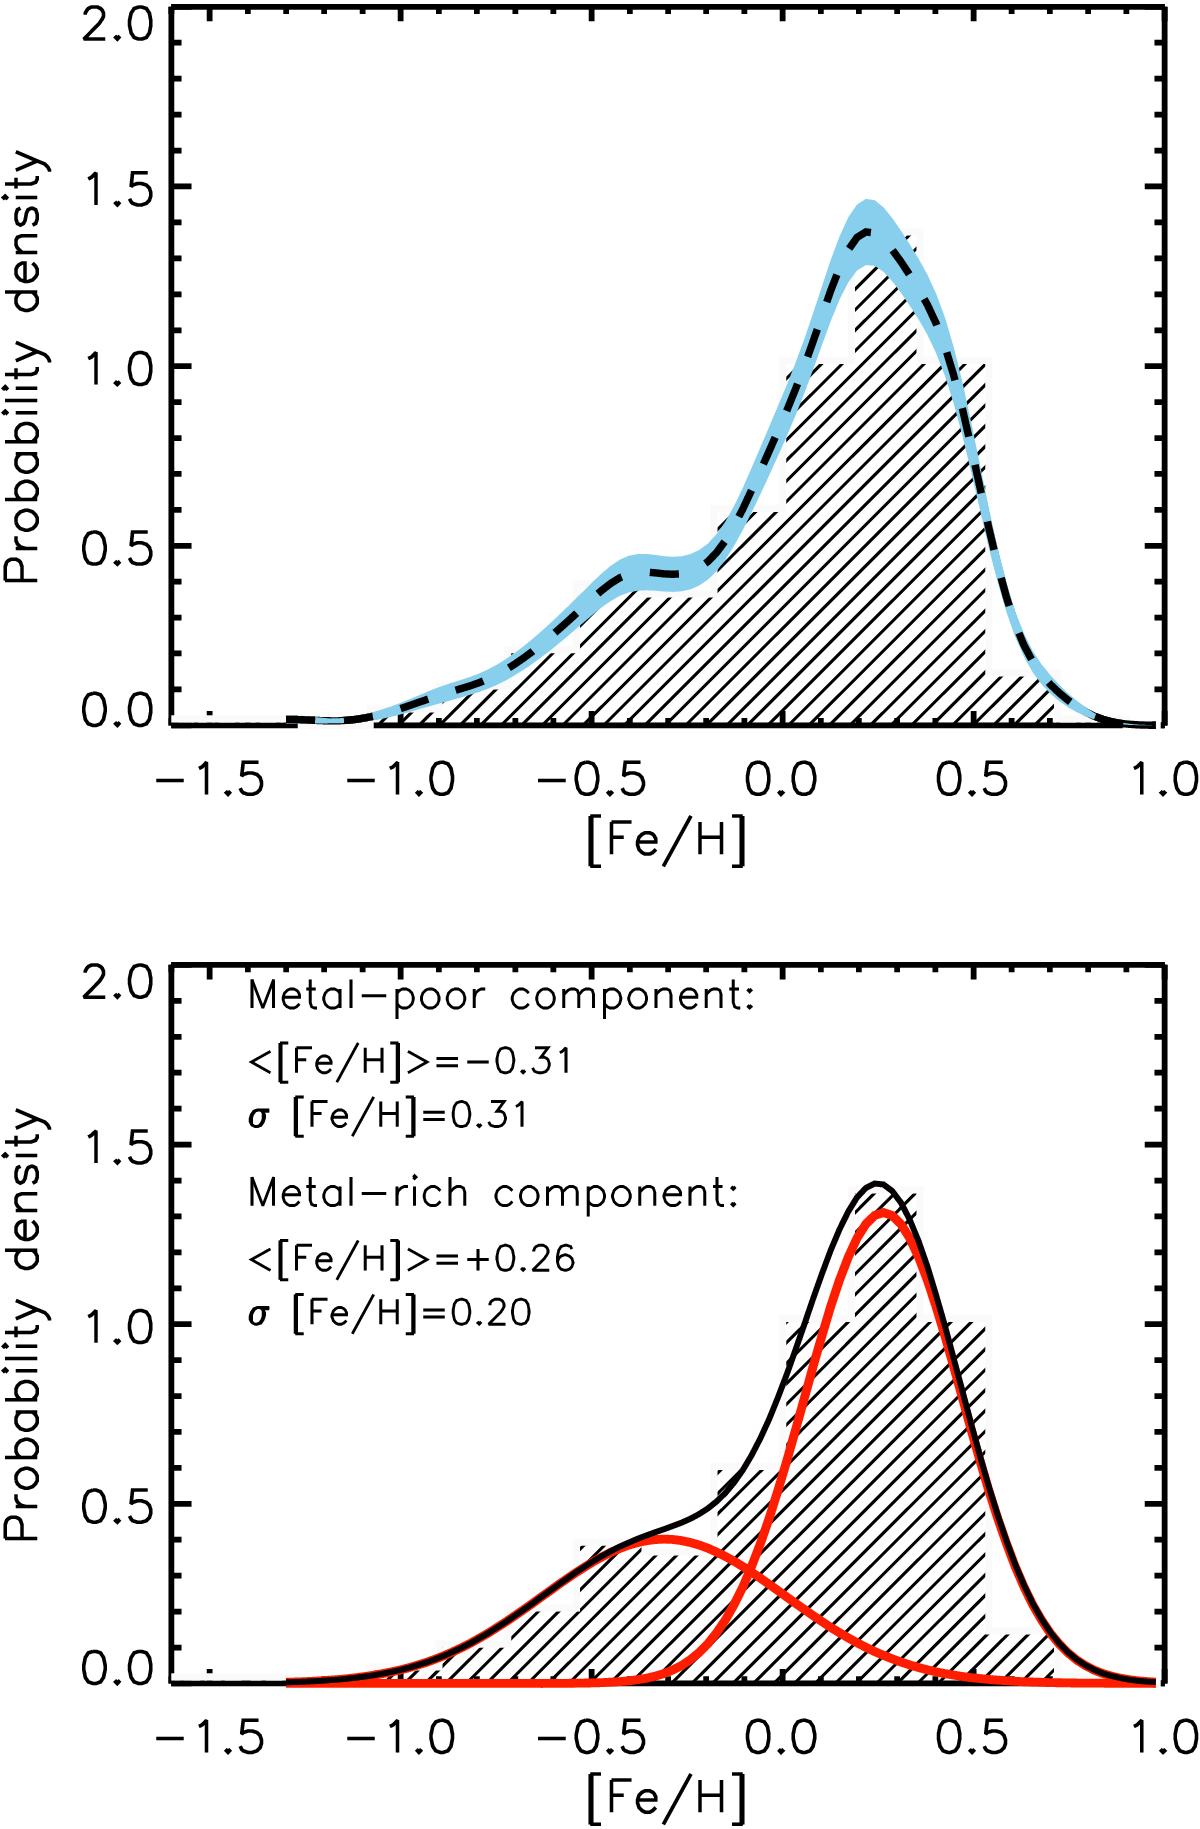
Overall metallicity distribution obtained from the combination of the four GIBS high-resolution fields and the RC sample of Hill et al. (2011). The probability density distribution is overplotted in the upper panel as a dashed line. The corresponding variance on the calculated probability densities is shown in blue. The lower panel shows the two best Gaussian fits to the upper panel distribution. The resulting distribution from the two Gaussians is shown as a solid line.
Current usage metrics show cumulative count of Article Views (full-text article views including HTML views, PDF and ePub downloads, according to the available data) and Abstracts Views on Vision4Press platform.
Data correspond to usage on the plateform after 2015. The current usage metrics is available 48-96 hours after online publication and is updated daily on week days.
Initial download of the metrics may take a while.