Fig. 5
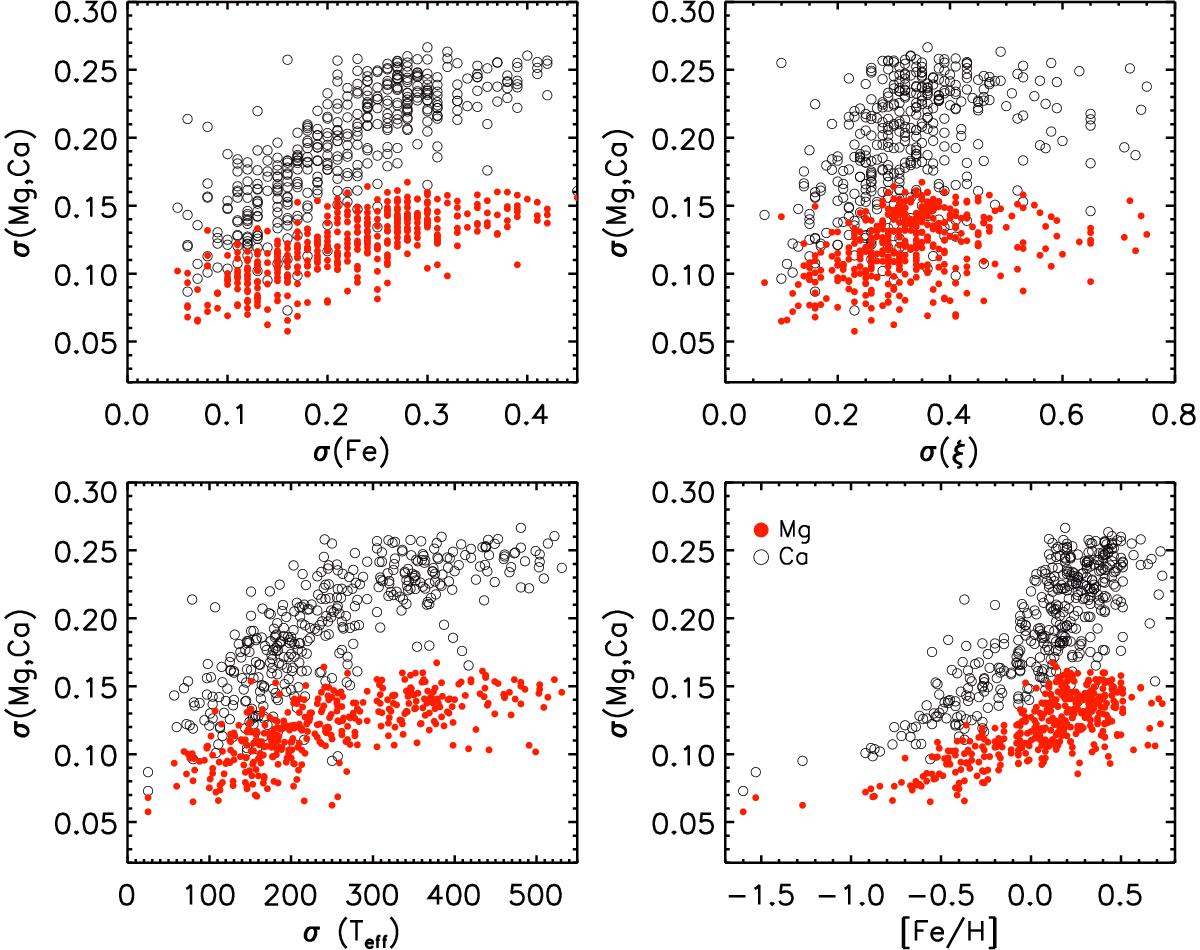
Abundance measurement errors as a function of errors on the stellar parameters: [Fe/H] (upper left panel), microturbulence velocity (upper right panel) and effective temperature (lower left panel). Errors as a function of the corresponding [Fe/H] value are also displayed (lower right panel). In all panels errors for [Ca/H] abundances are shown as red empty circles and errors for [Mg/H] as red filled circles.
Current usage metrics show cumulative count of Article Views (full-text article views including HTML views, PDF and ePub downloads, according to the available data) and Abstracts Views on Vision4Press platform.
Data correspond to usage on the plateform after 2015. The current usage metrics is available 48-96 hours after online publication and is updated daily on week days.
Initial download of the metrics may take a while.