Fig. 4
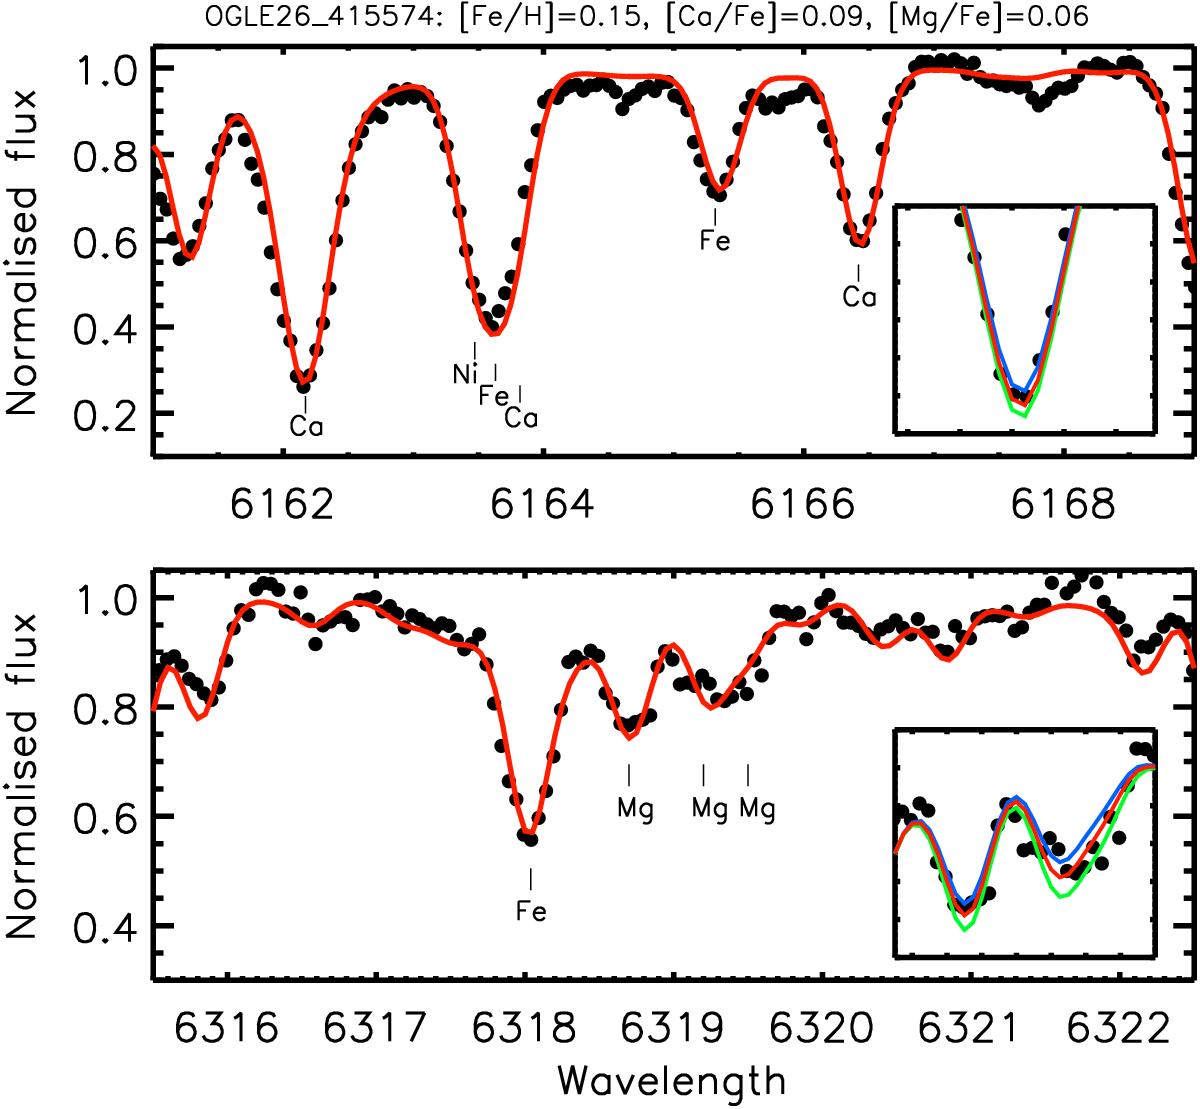
Observed (black circles) and synthetic spectra for a star (OGLE26-415574) in the field HRm5m3 zoomed into the region used to derive Ca (upper panel) and Mg (lower panel) abundances. The synthetic spectra created with the best-fitting Ca ([Ca/Fe] = 0.06) and Mg ([Mg/Fe] = 0.05) abundances are shown in solid red lines. The elements producing the strongest absorption lines are marked in each panel. For each spectral region we show a zoomed-in section around the Ca line at 6166.4 Å and the Mg triplet that includes the synthesis produced using the best-fitting abundance as red solid lines. In blue and green we show the synthetic spectra using a 0.1 dex abundance variation around the best-fitting value. The Y-axis of both zoomed-in regions have the same scale with normalised fluxes that range from 0.8–0.5 for Ca and 1.0–0.7 for Mg lines.
Current usage metrics show cumulative count of Article Views (full-text article views including HTML views, PDF and ePub downloads, according to the available data) and Abstracts Views on Vision4Press platform.
Data correspond to usage on the plateform after 2015. The current usage metrics is available 48-96 hours after online publication and is updated daily on week days.
Initial download of the metrics may take a while.