Fig. 2
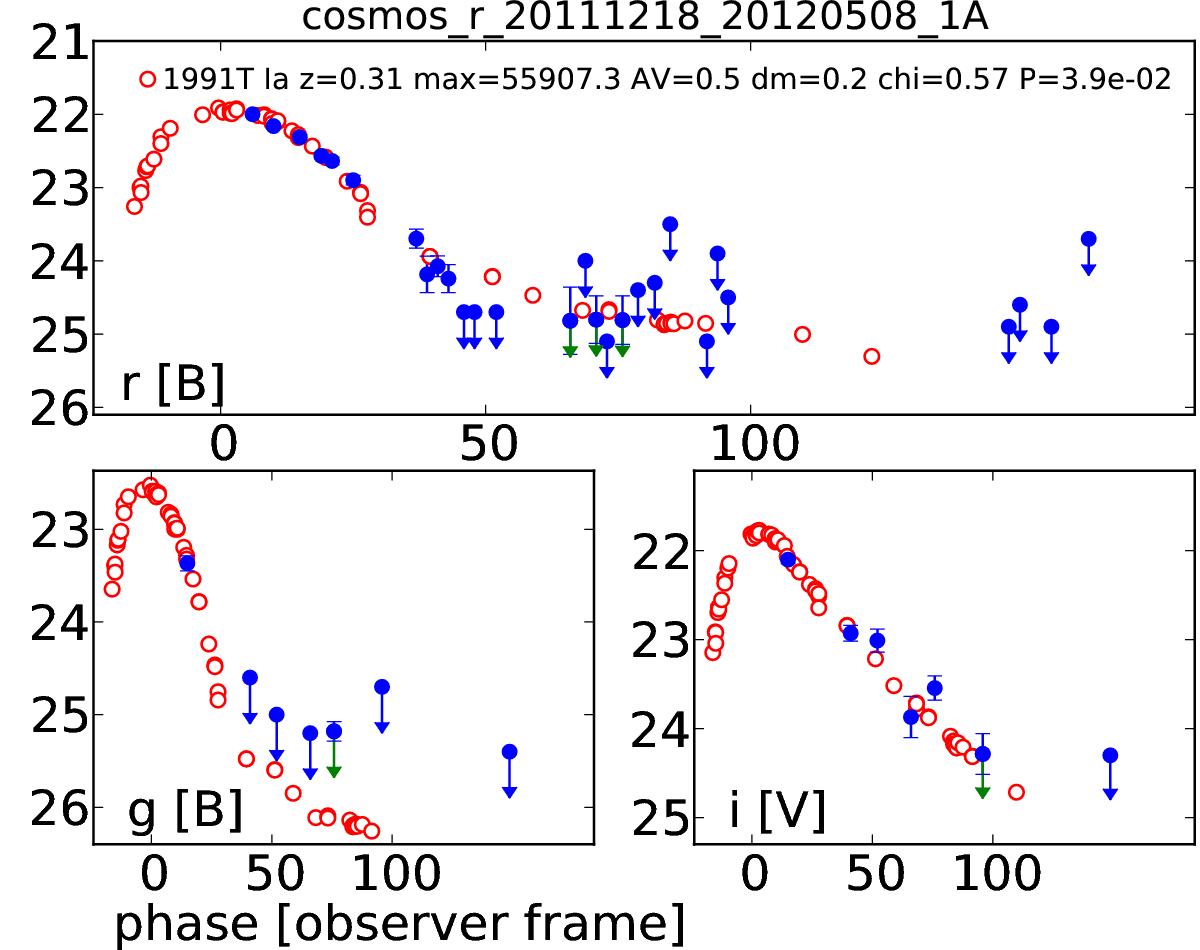
Example of the output of the SN-typing procedure. The top panel shows the observed r-band light curve that, in this case, is compared to the template K-corrected B-band light curve. The bottom panels show the observed light curve and template fit for the g band (left) and i band (right). Blue dots represent the SN candidate observed magnitudes (arrows indicate upper limits) while red open circles represent the template photometry. The legend identifies the best fitting template and parameters.
Current usage metrics show cumulative count of Article Views (full-text article views including HTML views, PDF and ePub downloads, according to the available data) and Abstracts Views on Vision4Press platform.
Data correspond to usage on the plateform after 2015. The current usage metrics is available 48-96 hours after online publication and is updated daily on week days.
Initial download of the metrics may take a while.