Free Access
Fig. 19
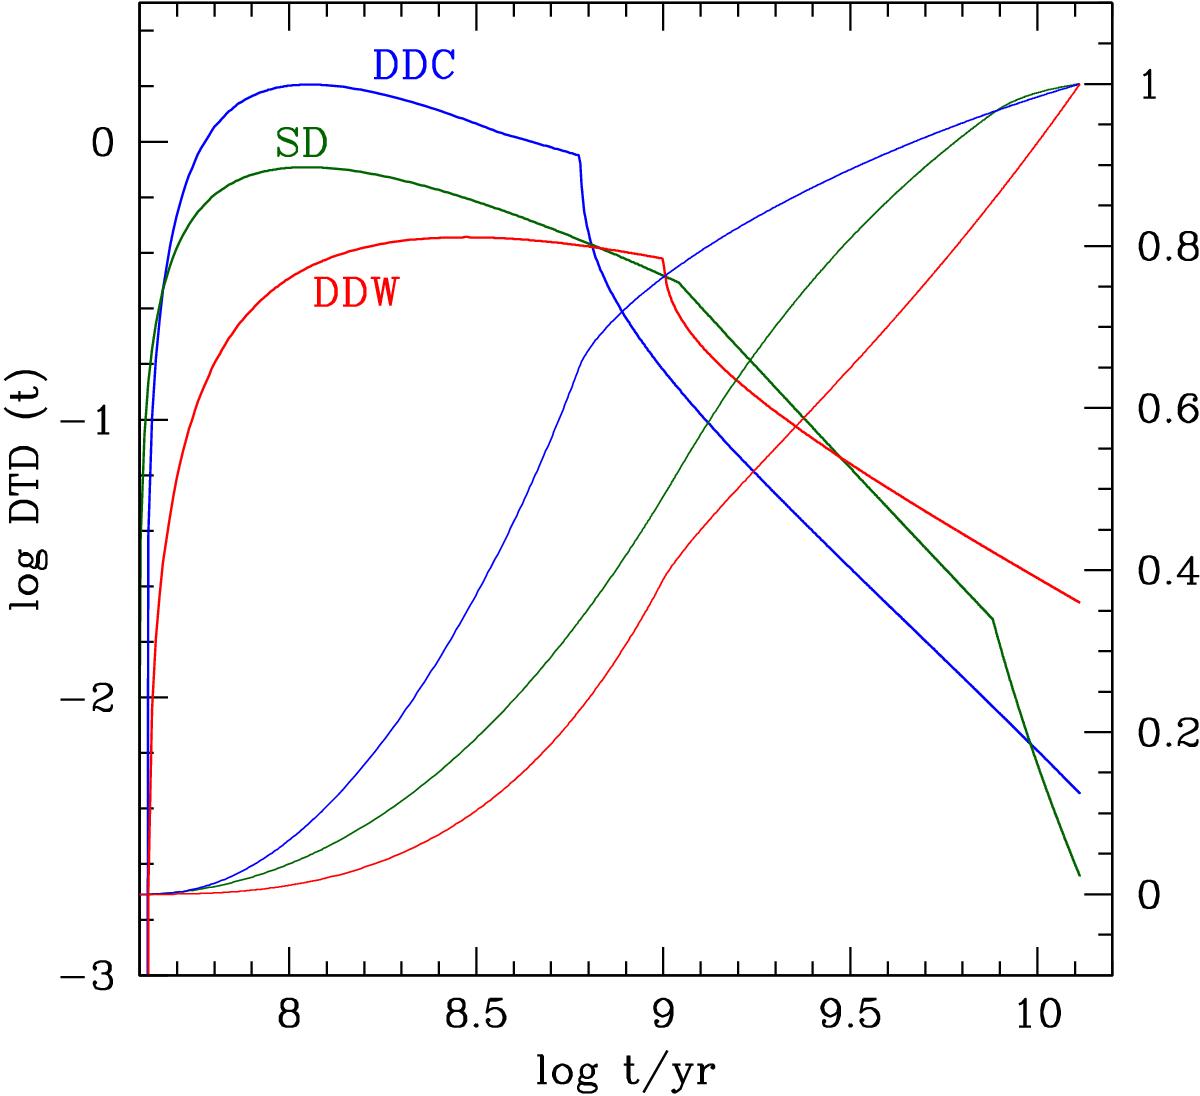
Distribution functions of the delay times that were selected for our theoretical predictions for the single degenerate (green), and double degenerate models (blue and red, see text for more details). The thin lines show the cumulative fraction of events as a function of time.
Current usage metrics show cumulative count of Article Views (full-text article views including HTML views, PDF and ePub downloads, according to the available data) and Abstracts Views on Vision4Press platform.
Data correspond to usage on the plateform after 2015. The current usage metrics is available 48-96 hours after online publication and is updated daily on week days.
Initial download of the metrics may take a while.