Fig. 18
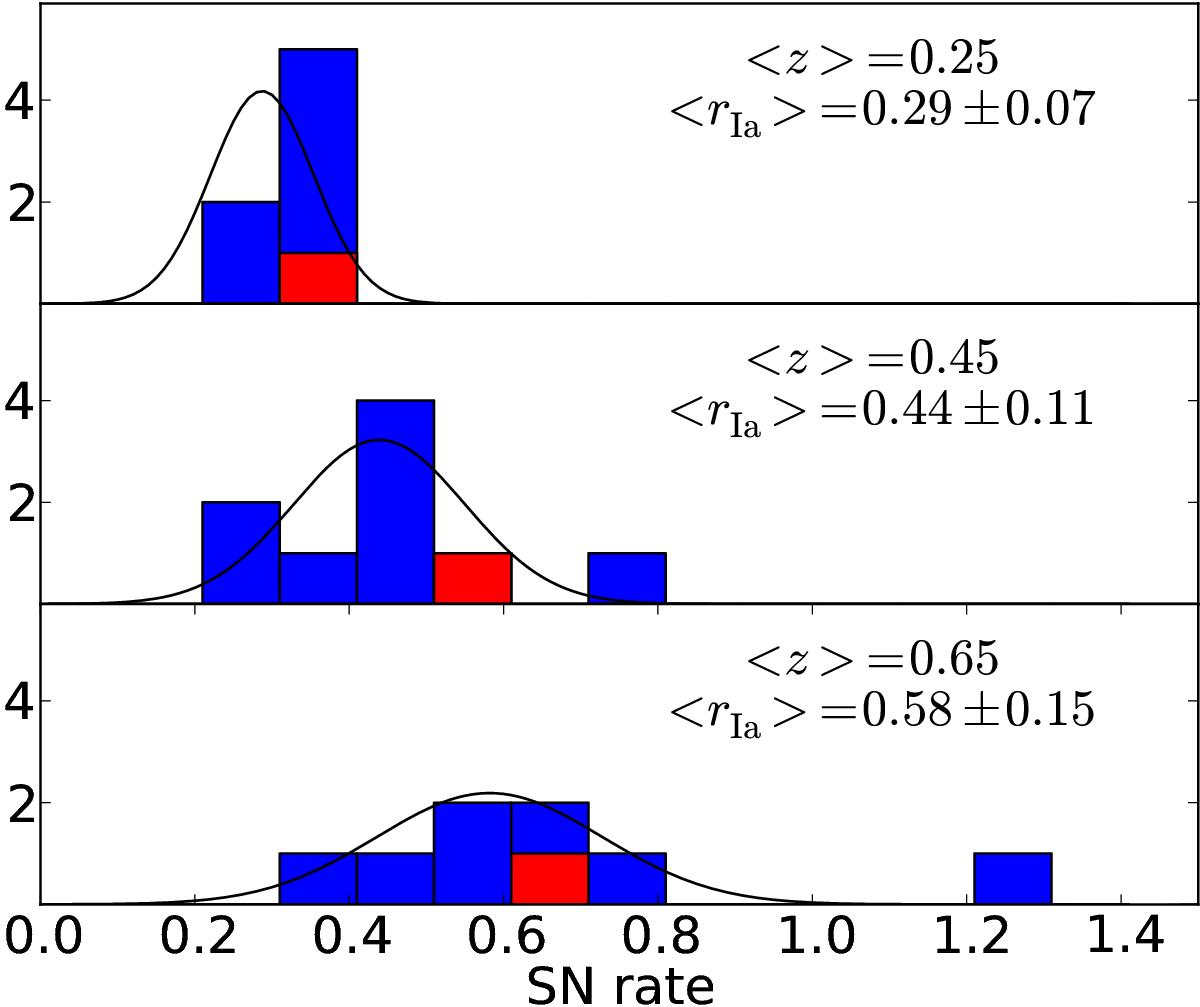
Histogram of published estimates of the SN Ia rate in the three redshift bins of our measurements. All values are scaled to the mean redshift of the bin, assuming a linear evolution of the rate with redshift (see text). In red we show our measurements. The black lines are the Gaussian curve whose mean and variance are computed from the data and reported in each panel’s legend. The averages and dispersions were computed by weighting the individual measurements with the inverse of their statistical errors.
Current usage metrics show cumulative count of Article Views (full-text article views including HTML views, PDF and ePub downloads, according to the available data) and Abstracts Views on Vision4Press platform.
Data correspond to usage on the plateform after 2015. The current usage metrics is available 48-96 hours after online publication and is updated daily on week days.
Initial download of the metrics may take a while.