Fig. 16
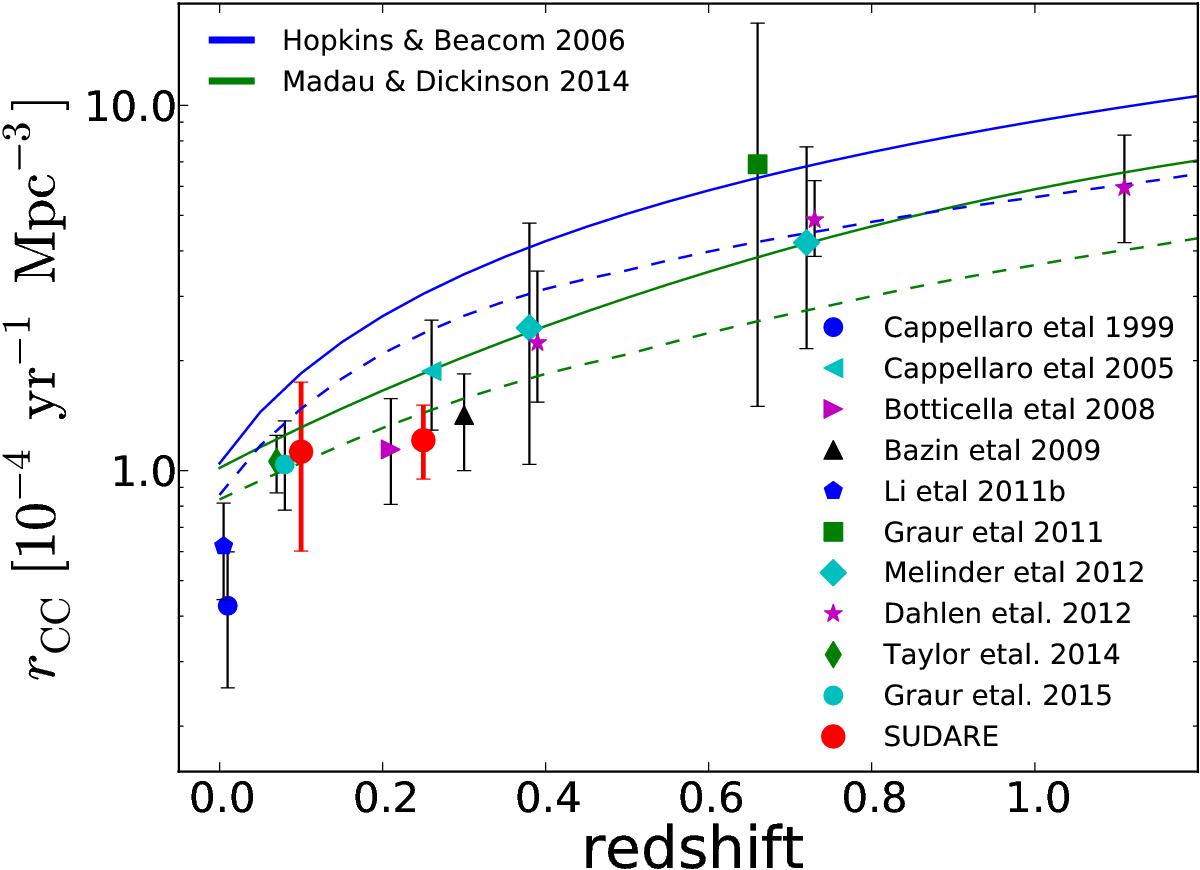
CC SN rate per unit volume. All measurements do not account for the correction for hidden SNe. To obtain the predicted SN rate from the measured SFR, we adopt 8, 40 M⊙ as the lower and upper mass limits for SN CC progenitors and the proper IMF, Salpeter for Madau & Dickinson (2014) and SalA for Hopkins & Beacom (2006). The dashed lines show the predicted SN rate, assuming the fraction of hidden SNe given in (Mattila et al. 2012).
Current usage metrics show cumulative count of Article Views (full-text article views including HTML views, PDF and ePub downloads, according to the available data) and Abstracts Views on Vision4Press platform.
Data correspond to usage on the plateform after 2015. The current usage metrics is available 48-96 hours after online publication and is updated daily on week days.
Initial download of the metrics may take a while.