Fig. 1
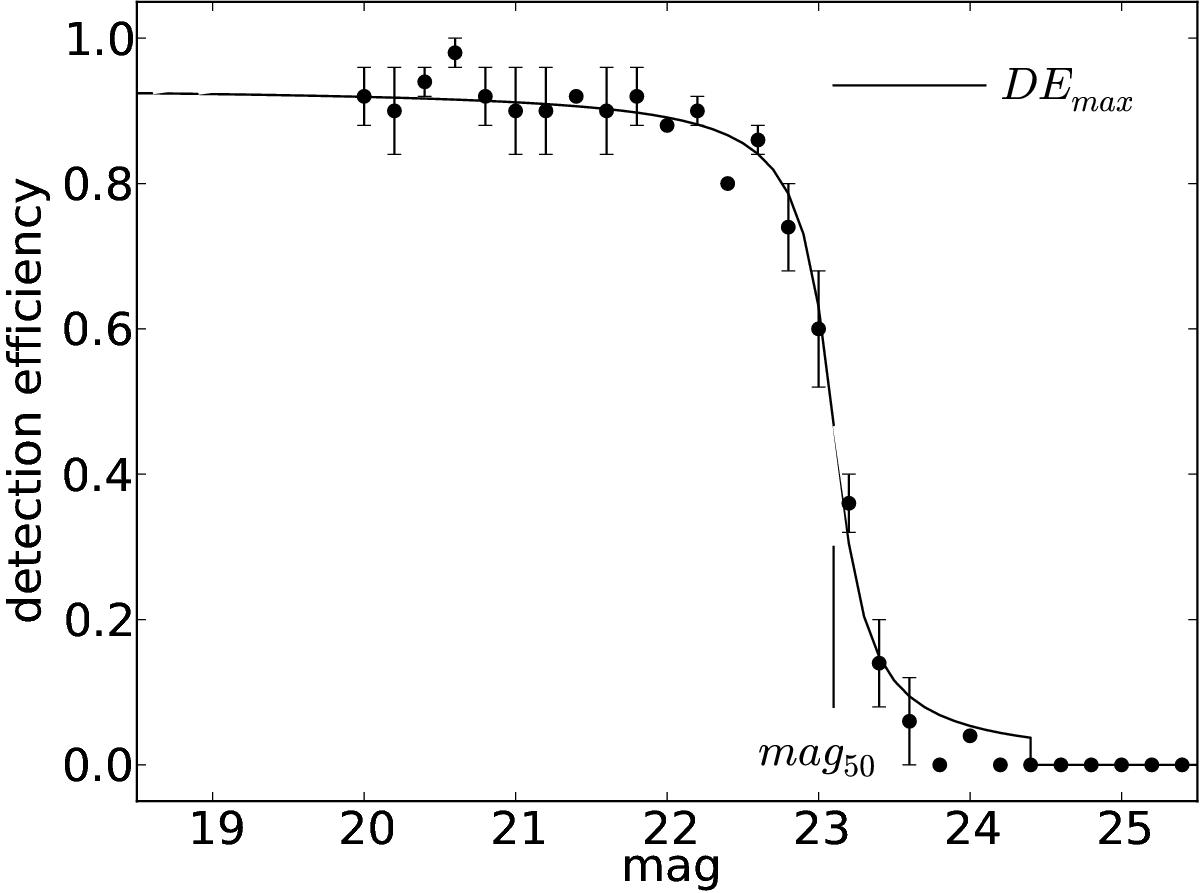
Transient detection efficiency as a function of magnitude for the r-band observation of COSMOS on 2012 March 15. The dots are the averages of 3 artificial star experiments with the errorbar being the dispersion whereas the line is the adopted efficiency curve after the fit with the Eq. (1) (DEmax = 93%, mag50 = 23.0 mag, and β = 6.1).
Current usage metrics show cumulative count of Article Views (full-text article views including HTML views, PDF and ePub downloads, according to the available data) and Abstracts Views on Vision4Press platform.
Data correspond to usage on the plateform after 2015. The current usage metrics is available 48-96 hours after online publication and is updated daily on week days.
Initial download of the metrics may take a while.