Fig. 9
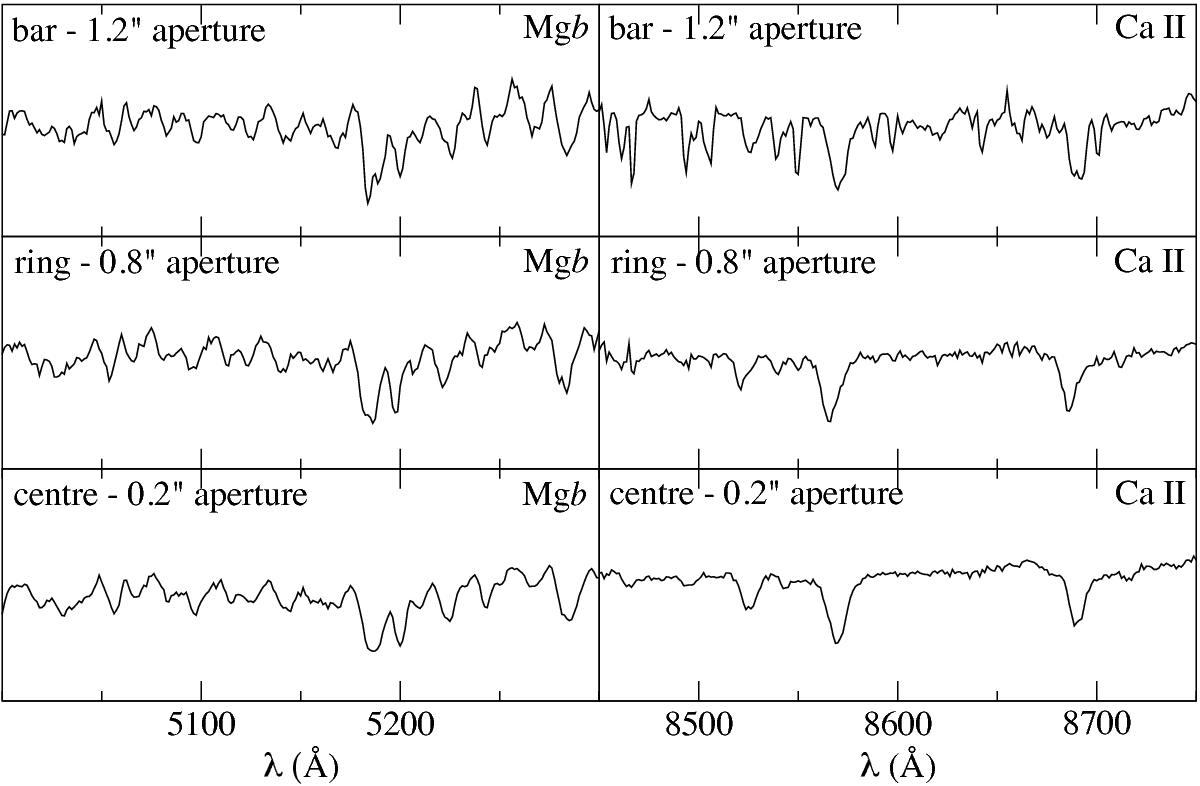
Sample of spectra extracted from our MUSE data cube. Left panels show the region around the Mgb feature, while right panels show the region around the CaII triplet. Top panels show the spectrum extracted from a region in the northern part of the bar, 25′′ from the centre, with an aperture of 1.2′′ or 6 spaxels in diameter. Middle panels show the spectrum obtained from the eastern side of the 10′′ ring with an aperture of 0.8′′. Finally, bottom panels show the spectrum from the central spaxel.
Current usage metrics show cumulative count of Article Views (full-text article views including HTML views, PDF and ePub downloads, according to the available data) and Abstracts Views on Vision4Press platform.
Data correspond to usage on the plateform after 2015. The current usage metrics is available 48-96 hours after online publication and is updated daily on week days.
Initial download of the metrics may take a while.