Fig. 14
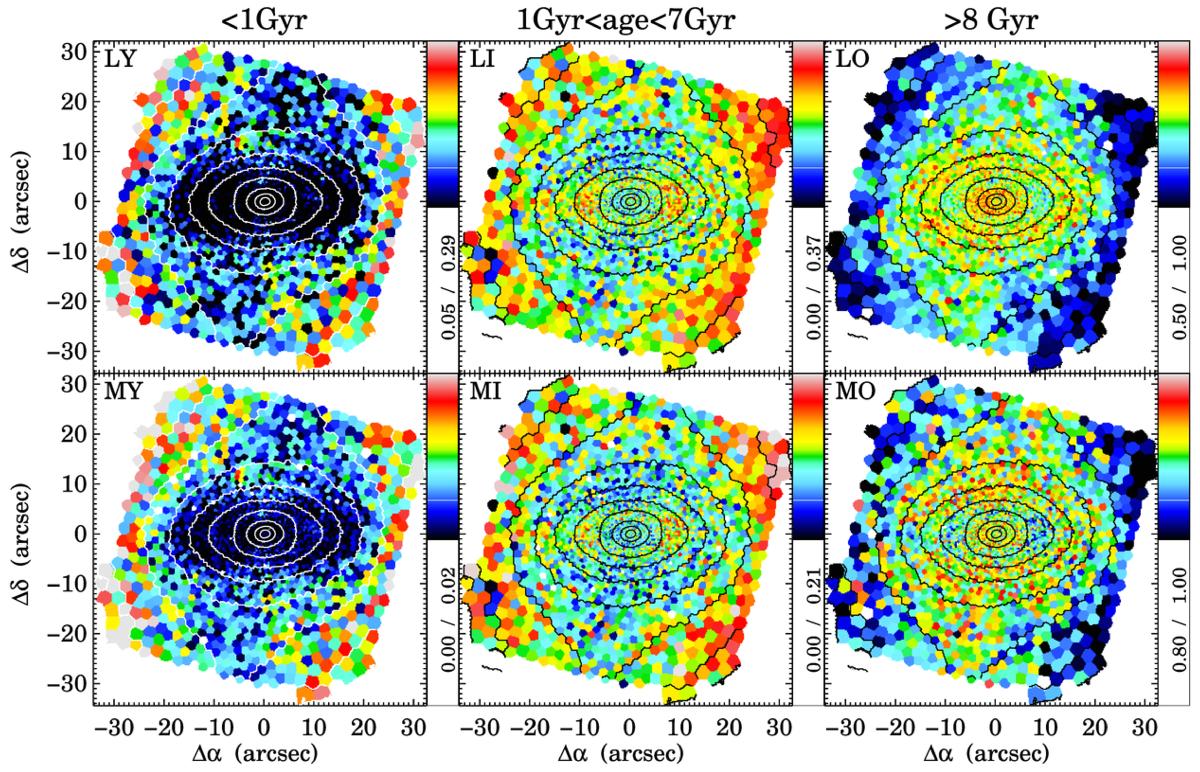
Top panels: luminosity-weighted maps of stellar populations separated by mean stellar age, as indicated (young; intermediate; old). The colour-coded scale, indicated by the colour bar on the right side of each panel, corresponds to the fraction of the stellar population (young, intermediate, or old) at each spatial element. Bottom panels: corresponding mass-weighted maps. The scale changes for each panel to show the corresponding relevant features. The indicated limits of the colour bars, however, show that most of the mass and light are in (or come from) stars older than 8 Gyr.
Current usage metrics show cumulative count of Article Views (full-text article views including HTML views, PDF and ePub downloads, according to the available data) and Abstracts Views on Vision4Press platform.
Data correspond to usage on the plateform after 2015. The current usage metrics is available 48-96 hours after online publication and is updated daily on week days.
Initial download of the metrics may take a while.