Fig. 10
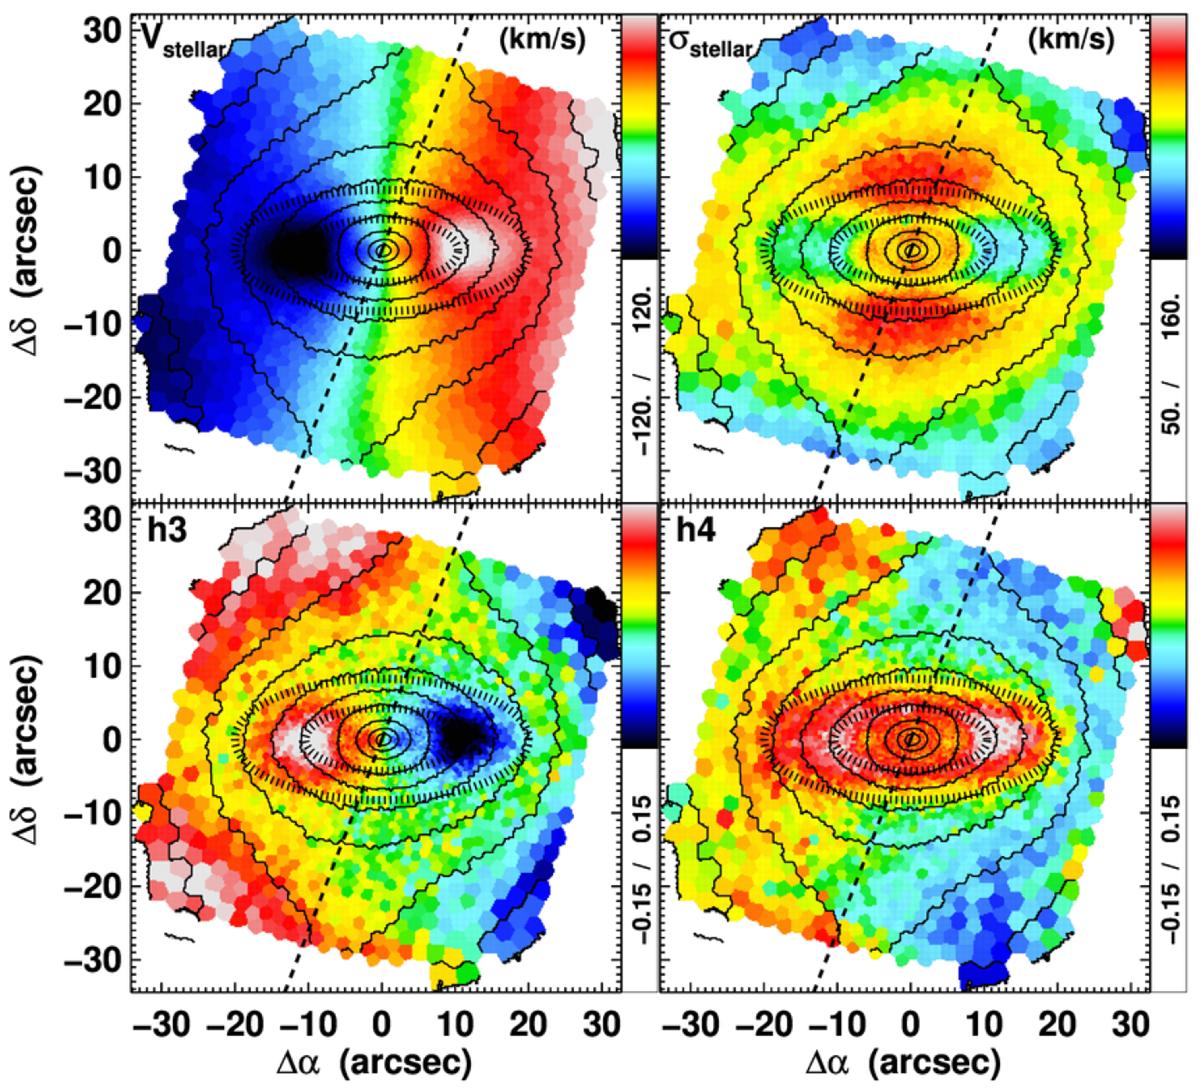
Radial velocity, velocity dispersion, and h3 and h4 maps for the stellar component in NGC 4371, as indicated. The colour bars on the side of each panel indicate the plotted range of the parameter measured. For radial velocity and velocity dispersion these are given in km s-1. The isophotes shown are derived from the MUSE cube reconstructed intensities and are equally spaced in steps of about 0.5 mag. North is up, east to the left. The nearly vertical dashed line indicates the position of the bar major axis. The horizontal elongated markings indicate the outer boundary of the region dominated by the inner disc, at ~20′′, as derived through the ellipse fits, and the position of the 10′′ ring.
Current usage metrics show cumulative count of Article Views (full-text article views including HTML views, PDF and ePub downloads, according to the available data) and Abstracts Views on Vision4Press platform.
Data correspond to usage on the plateform after 2015. The current usage metrics is available 48-96 hours after online publication and is updated daily on week days.
Initial download of the metrics may take a while.