Free Access
Fig. 3
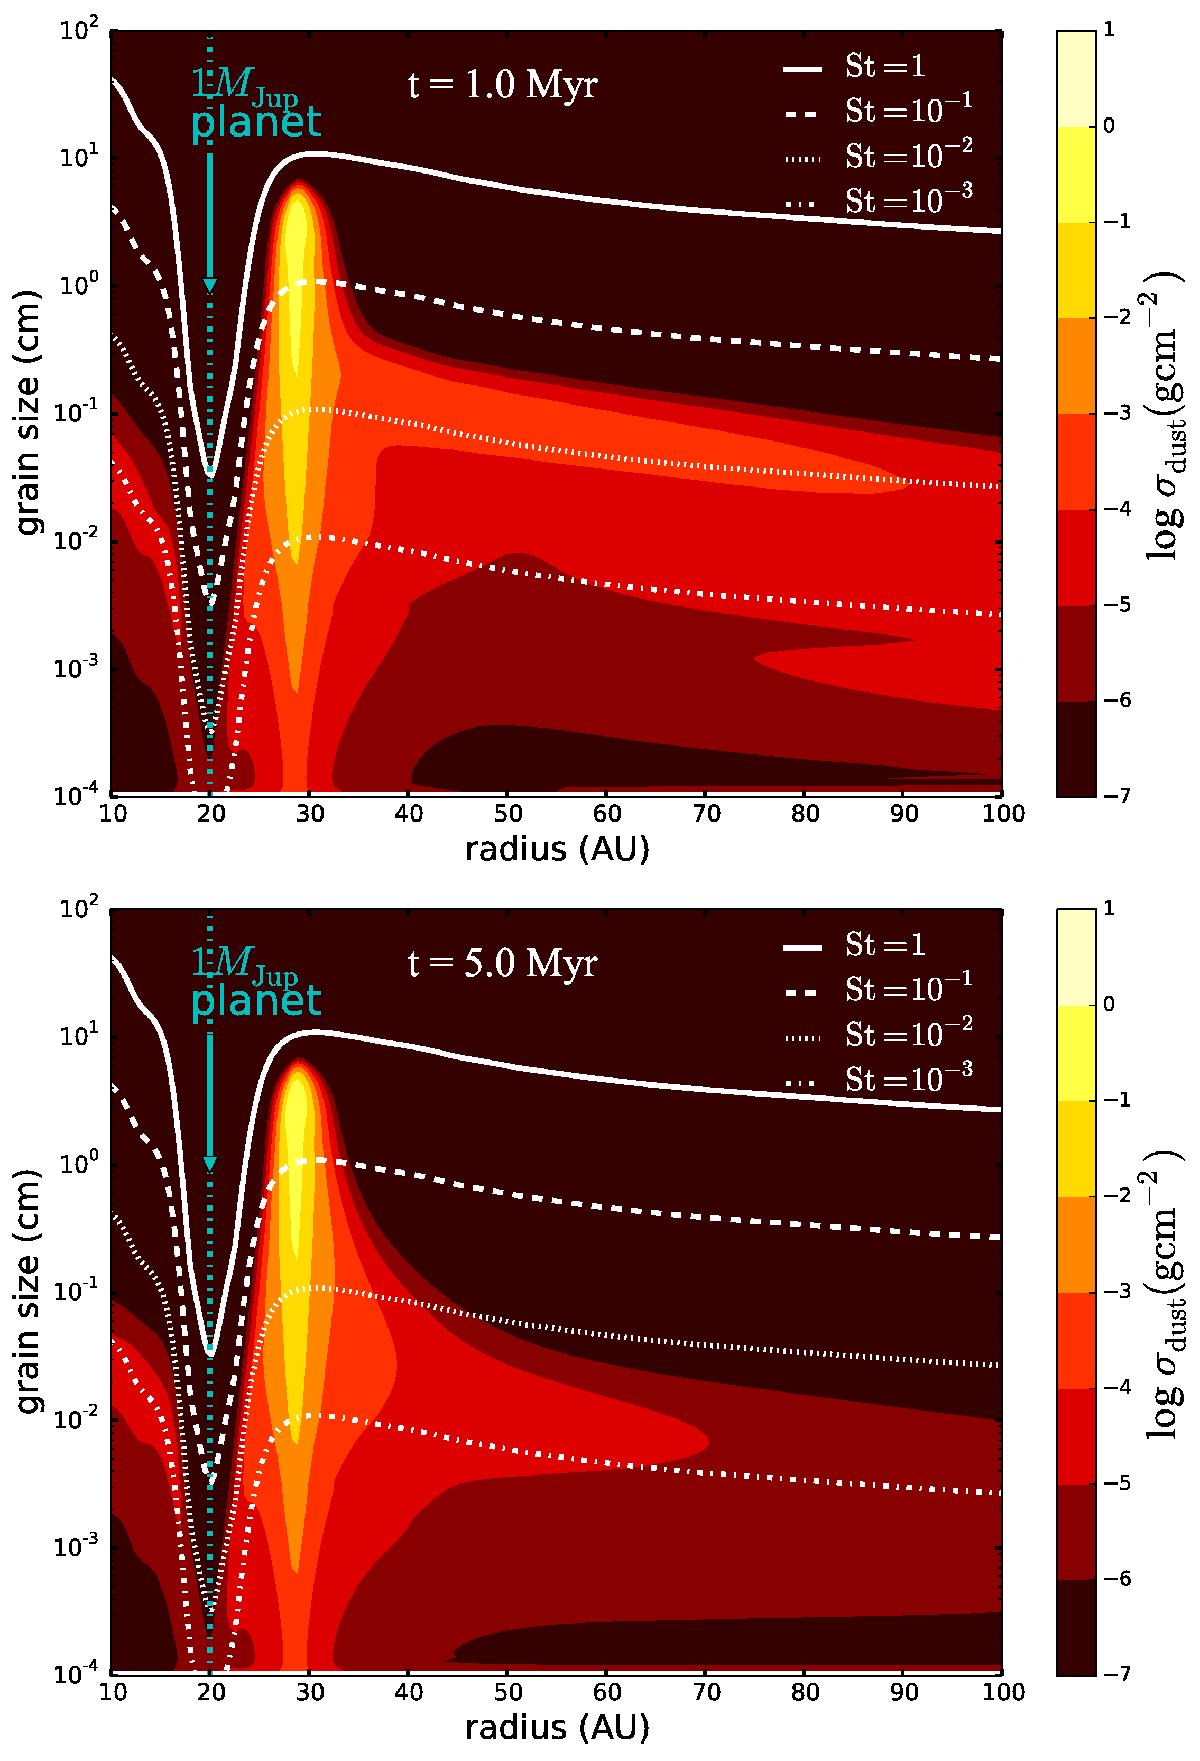
Dust density distribution when 1 MJup is embedded at 20 AU after 1 and 5 Myr of evolution (top and bottom panel respectively). The lines represent particle sizes with different Stokes numbers (St = [10-3,10-2,10-1,1]), which are proportional to the gas surface density profile.
This figure is made of several images, please see below:
Current usage metrics show cumulative count of Article Views (full-text article views including HTML views, PDF and ePub downloads, according to the available data) and Abstracts Views on Vision4Press platform.
Data correspond to usage on the plateform after 2015. The current usage metrics is available 48-96 hours after online publication and is updated daily on week days.
Initial download of the metrics may take a while.