Fig. 1
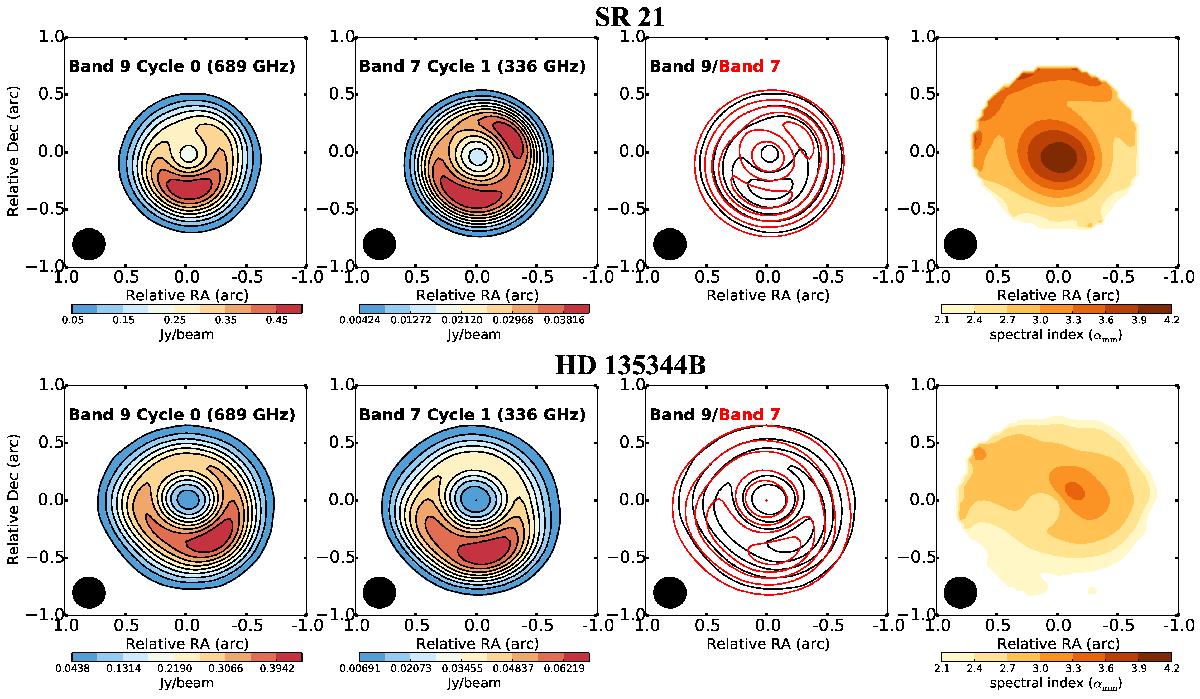
ALMA observations of dust continuum emission for SR 21 (top panels) and HD 135344B (bottom panels). The left columns show the Band 9 (689 GHz) and Band 7 (336 GHz) continuum, with the contour overlaid at 10, 20, ..., 90% of the peak. The third column shows the overlay of the contours with a step of 20% of the peak (black is Band 9, red is Band 7). The right column shows the resolved αmm in colour contours. The beam size is indicated in each plot.
Current usage metrics show cumulative count of Article Views (full-text article views including HTML views, PDF and ePub downloads, according to the available data) and Abstracts Views on Vision4Press platform.
Data correspond to usage on the plateform after 2015. The current usage metrics is available 48-96 hours after online publication and is updated daily on week days.
Initial download of the metrics may take a while.