Fig. 8
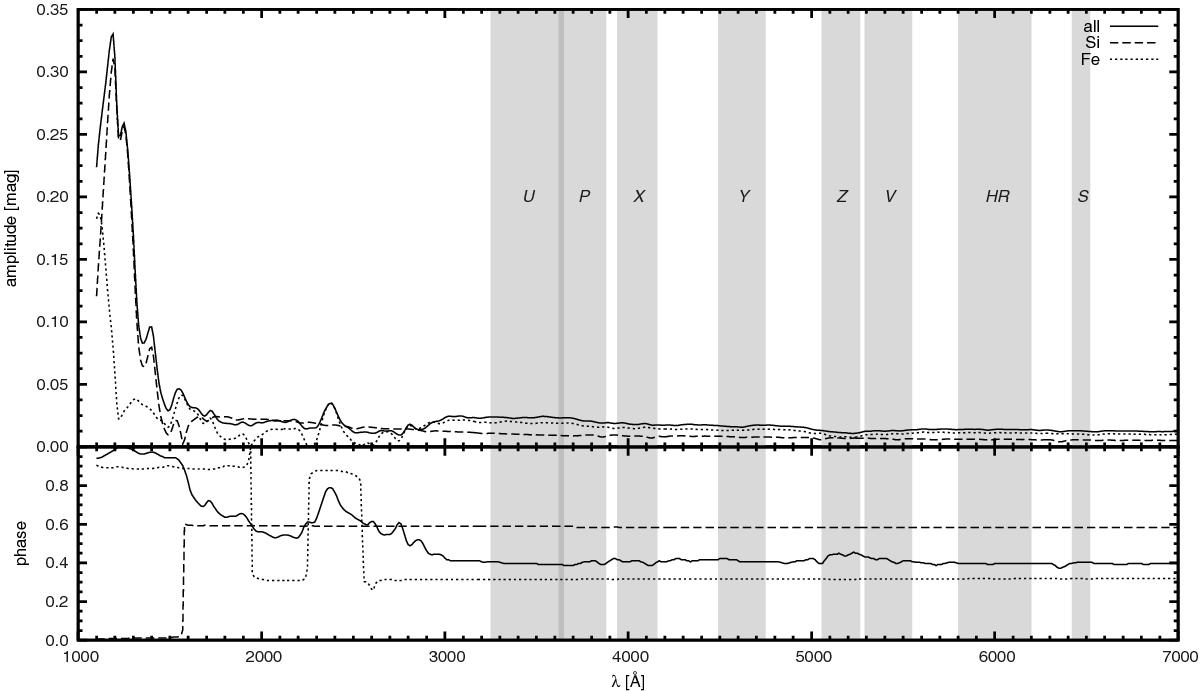
Upper plot: predicted amplitude (half of the difference between the maximum and the minimum magnitude of the star) of the photometric variability of the star in Gaussian passbands with a dispersion of 20 Å as a function of wavelength. Lower plot: phase of the minimum of the variability of the star in the same passbands plotted against the wavelength.
Current usage metrics show cumulative count of Article Views (full-text article views including HTML views, PDF and ePub downloads, according to the available data) and Abstracts Views on Vision4Press platform.
Data correspond to usage on the plateform after 2015. The current usage metrics is available 48-96 hours after online publication and is updated daily on week days.
Initial download of the metrics may take a while.