Fig. 7
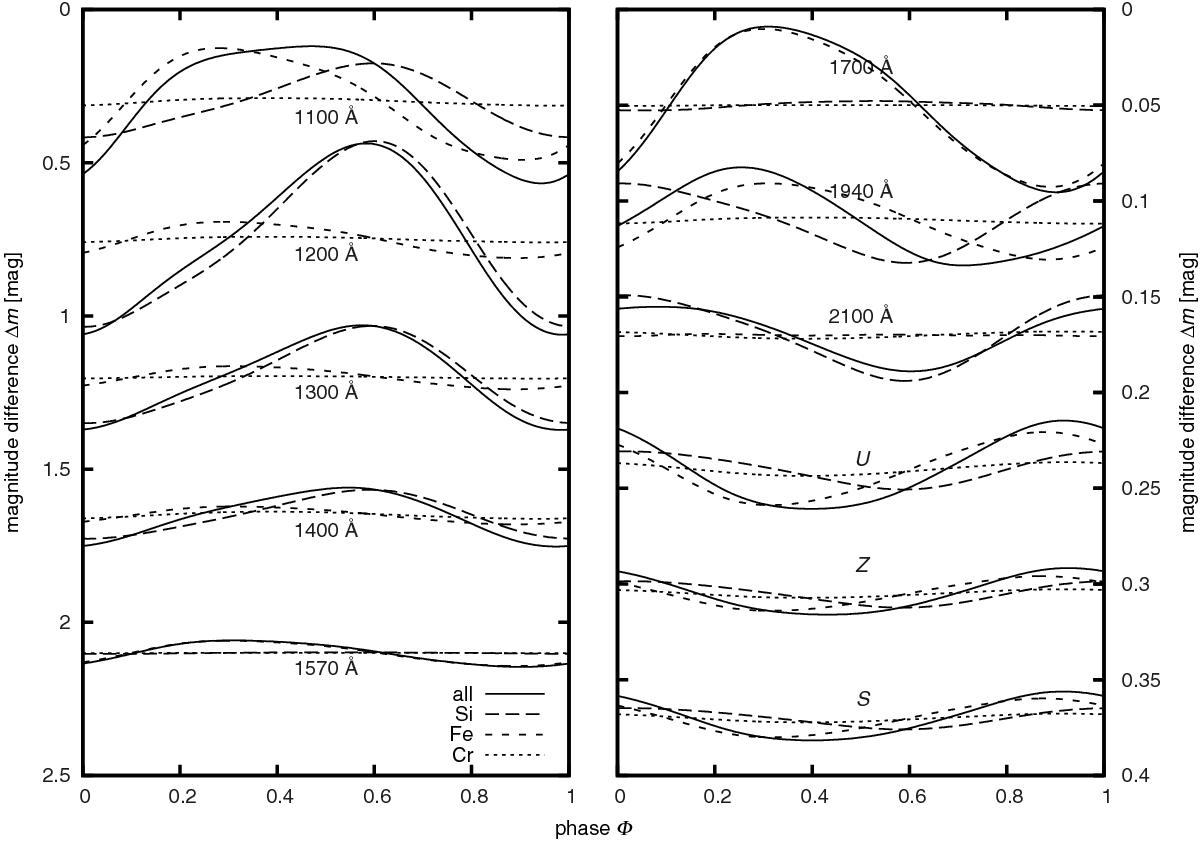
Light curves of ϕ Dra synthesised using the abundance maps of the individual elements separately, compared to the overall variability of the star (solid line) in several Gaussian passbands with the dispersion of 20 Å in the UV and the passbands U,Z, and S of the ten-colour photometric system. The light curves have been shifted vertically to better demonstrate the variability. We note the very different vertical scales of the two panels.
Current usage metrics show cumulative count of Article Views (full-text article views including HTML views, PDF and ePub downloads, according to the available data) and Abstracts Views on Vision4Press platform.
Data correspond to usage on the plateform after 2015. The current usage metrics is available 48-96 hours after online publication and is updated daily on week days.
Initial download of the metrics may take a while.