Fig. 3
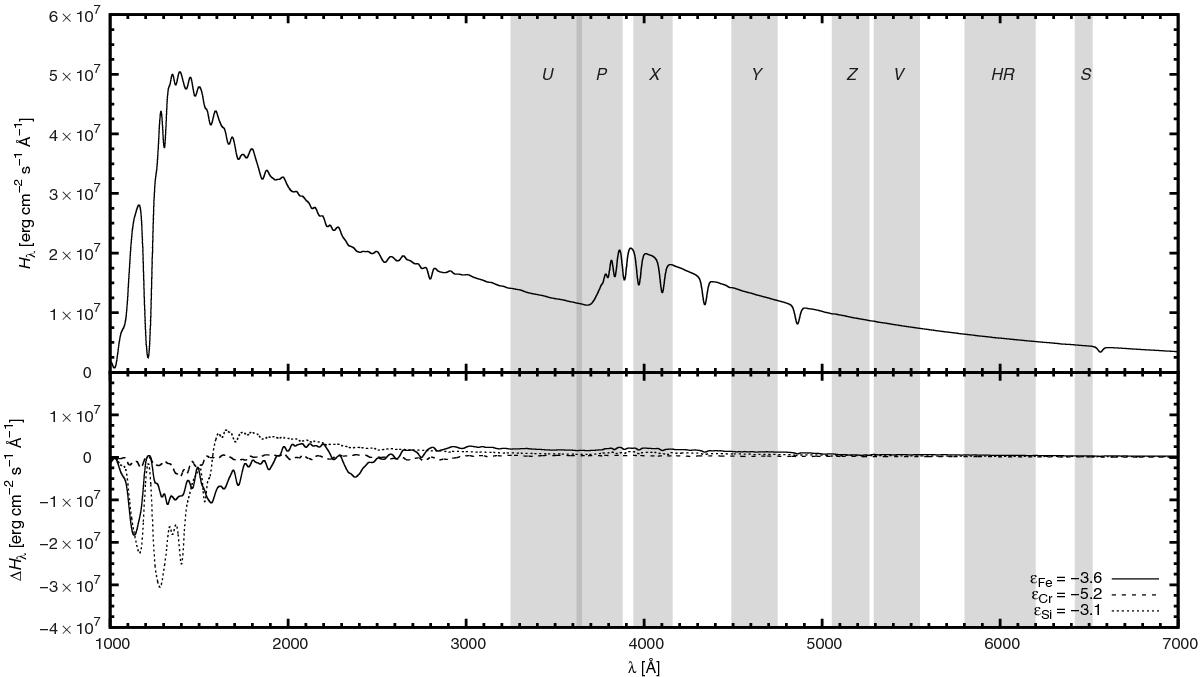
Upper plot: emergent flux from a reference model atmosphere with εSi = −4.6, εCr = −6.7, and εFe = −5.1. Lower plot: emergent flux from the model atmospheres with modified abundance of individual elements minus the flux from the reference model. All fluxes were smoothed by a Gaussian filter with a dispersion of 10 Å to show the changes in continuum, which are important for SED variability. The passbands of the ten-colour photometric system are shown in the graph as grey areas.
Current usage metrics show cumulative count of Article Views (full-text article views including HTML views, PDF and ePub downloads, according to the available data) and Abstracts Views on Vision4Press platform.
Data correspond to usage on the plateform after 2015. The current usage metrics is available 48-96 hours after online publication and is updated daily on week days.
Initial download of the metrics may take a while.