Fig. 1
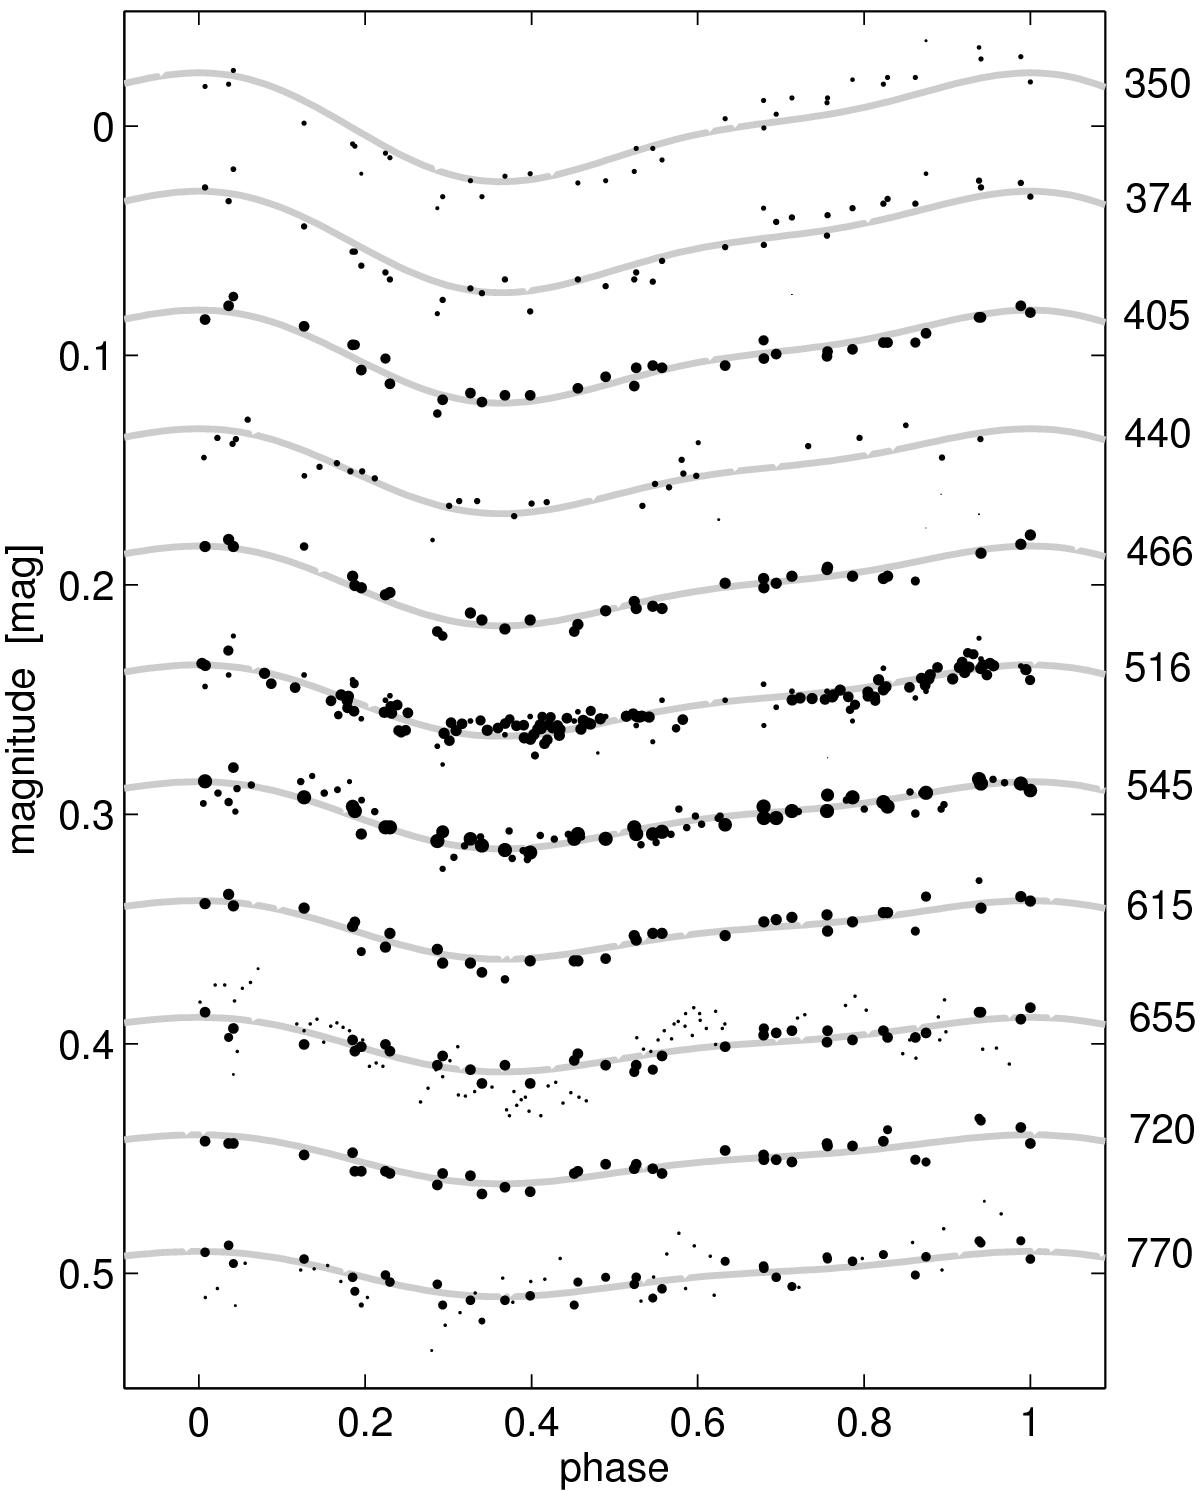
Light curves of ϕ Dra in 11 photometric colours with effective wavelengths from 350 to 770 nm (on the right) plotted versus the new ephemeris with zero phase at the maximum (Eq. (3)). Grey full lines are the fits calculated by the simple model of ϕ Dra light variability (Eq. (1)). Light curves are vertically shifted to better display the light variability. Areas of individual symbols are proportional to the weight of the measurement.
Current usage metrics show cumulative count of Article Views (full-text article views including HTML views, PDF and ePub downloads, according to the available data) and Abstracts Views on Vision4Press platform.
Data correspond to usage on the plateform after 2015. The current usage metrics is available 48-96 hours after online publication and is updated daily on week days.
Initial download of the metrics may take a while.