Fig. 3
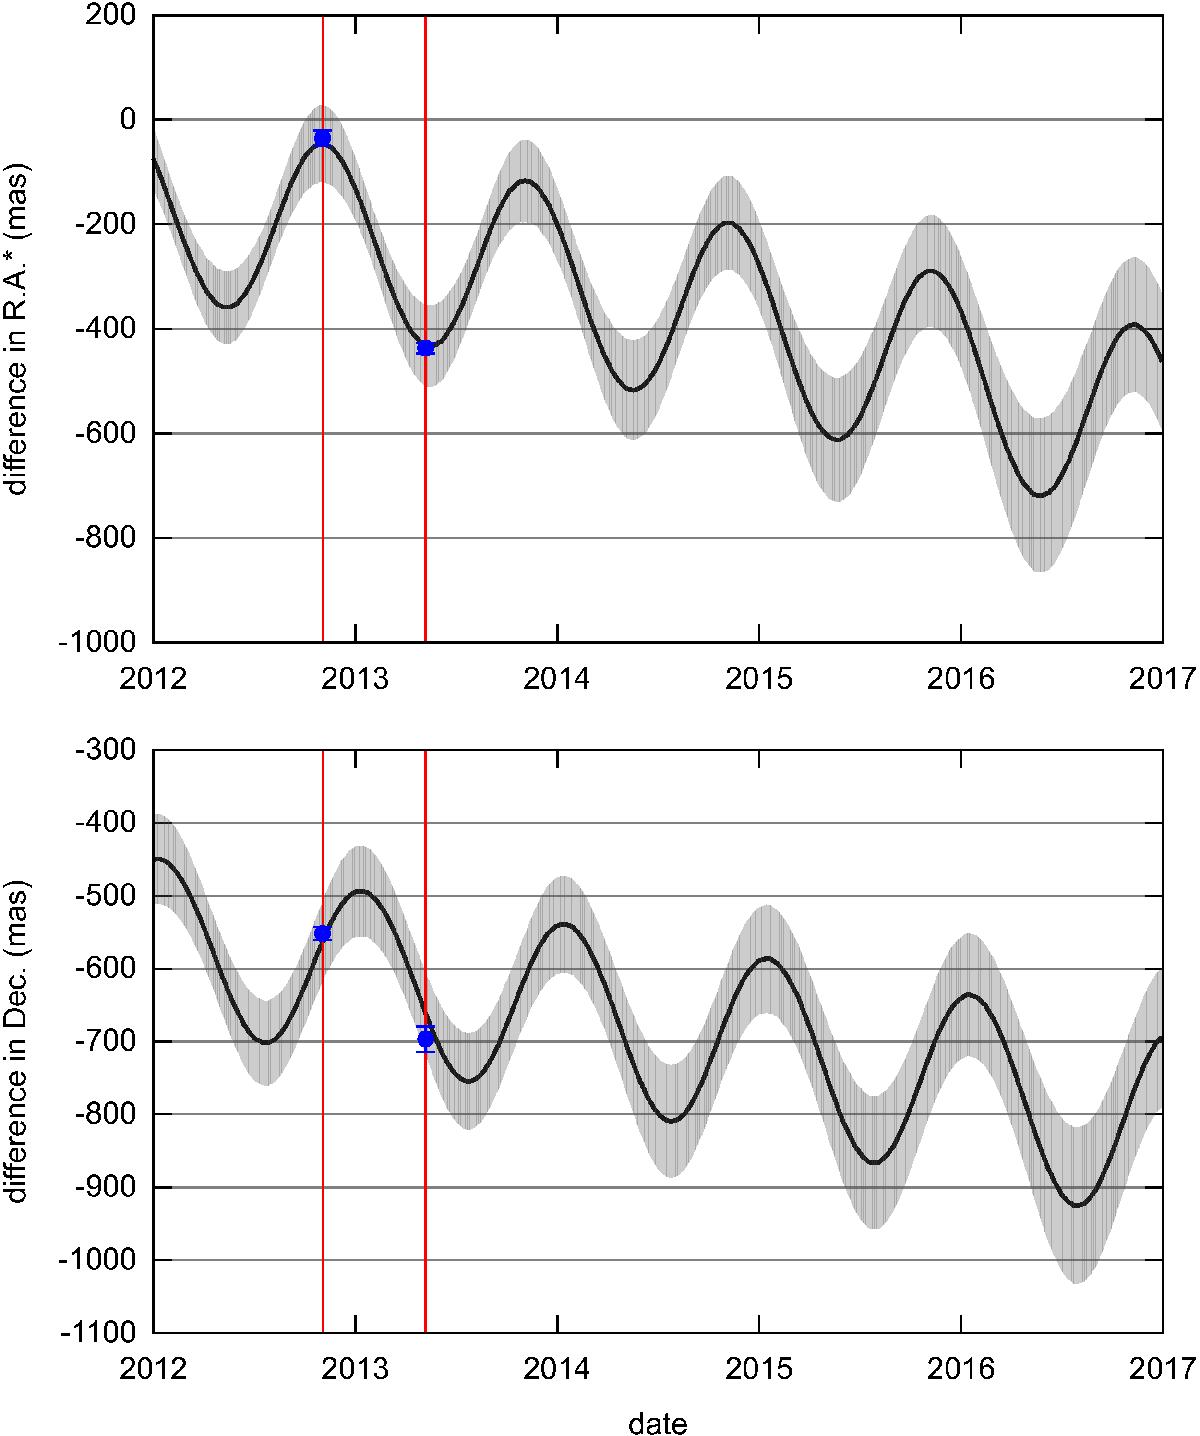
Difference between NIMA and JPL ephemerides for 2004NT33 in right ascension (weighted by cosδ) and declination during 2012–2017. The grey area represents the uncertainty of NIMA ephemeris. The sets of observations correspond to one single night of offset observations where several observations were performed. The blue dots represent the average positions of each set and the error bar represents the standard deviation (1σ).
Current usage metrics show cumulative count of Article Views (full-text article views including HTML views, PDF and ePub downloads, according to the available data) and Abstracts Views on Vision4Press platform.
Data correspond to usage on the plateform after 2015. The current usage metrics is available 48-96 hours after online publication and is updated daily on week days.
Initial download of the metrics may take a while.