Fig. 4
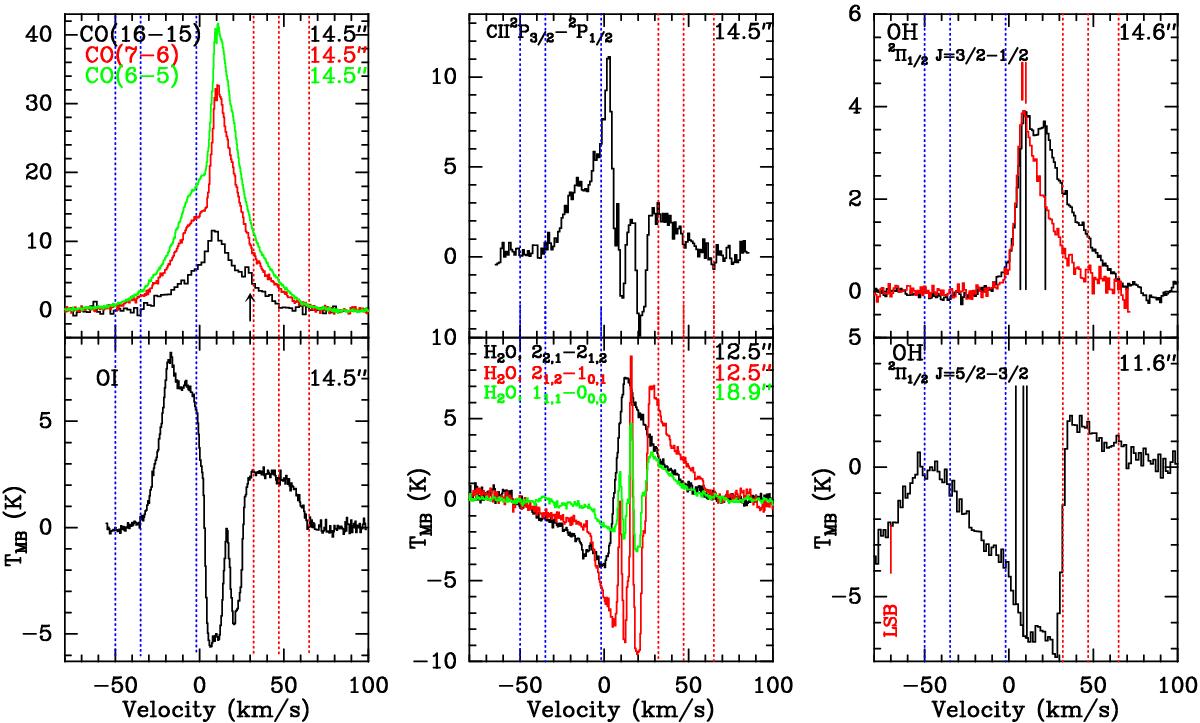
Comparison of the [OI]63μm line profile from the central position of the map with other molecular and atomic features. The [OI]63μm, [CII], CO(6–5) and CO(7–6) spectra are extracted from a map smoothed to ![]() to match the resolution of the CO(16–15) data. The other lines are shown at their original angular resolutions (shown in each panel). In all panels, the blue and red dashed lines indicate the HV and LV ranges (HV ranges: Δνblue = [−50,−35] km s-1; Δνred = [ + 47, + 65] km s-1; LV ranges: Δνblue = [−35,−2] km s-1; Δνred = [ + 32, + 47] km s-1). The arrow in the top left panel marks the feature at + 30 km s-1 in the CO(16–15) spectrum due to a telluric line and probably also to a high-velocity bullet. The red label LSB in the bottom right panel with the OH
to match the resolution of the CO(16–15) data. The other lines are shown at their original angular resolutions (shown in each panel). In all panels, the blue and red dashed lines indicate the HV and LV ranges (HV ranges: Δνblue = [−50,−35] km s-1; Δνred = [ + 47, + 65] km s-1; LV ranges: Δνblue = [−35,−2] km s-1; Δνred = [ + 32, + 47] km s-1). The arrow in the top left panel marks the feature at + 30 km s-1 in the CO(16–15) spectrum due to a telluric line and probably also to a high-velocity bullet. The red label LSB in the bottom right panel with the OH ![]() triplet shows the blue-shifted wing of the second triplet from the lower sideband of the receiver. The top right panel shows the two OH
triplet shows the blue-shifted wing of the second triplet from the lower sideband of the receiver. The top right panel shows the two OH ![]() triplets at 1837 GHz (black line) and 1834 GHz (red line, detected in the lower sideband of the L2 GREAT receiver). The solid black and red vertical lines in the two panels with the OH lines show the three components of each triplet.
triplets at 1837 GHz (black line) and 1834 GHz (red line, detected in the lower sideband of the L2 GREAT receiver). The solid black and red vertical lines in the two panels with the OH lines show the three components of each triplet.
Current usage metrics show cumulative count of Article Views (full-text article views including HTML views, PDF and ePub downloads, according to the available data) and Abstracts Views on Vision4Press platform.
Data correspond to usage on the plateform after 2015. The current usage metrics is available 48-96 hours after online publication and is updated daily on week days.
Initial download of the metrics may take a while.