Fig. 3
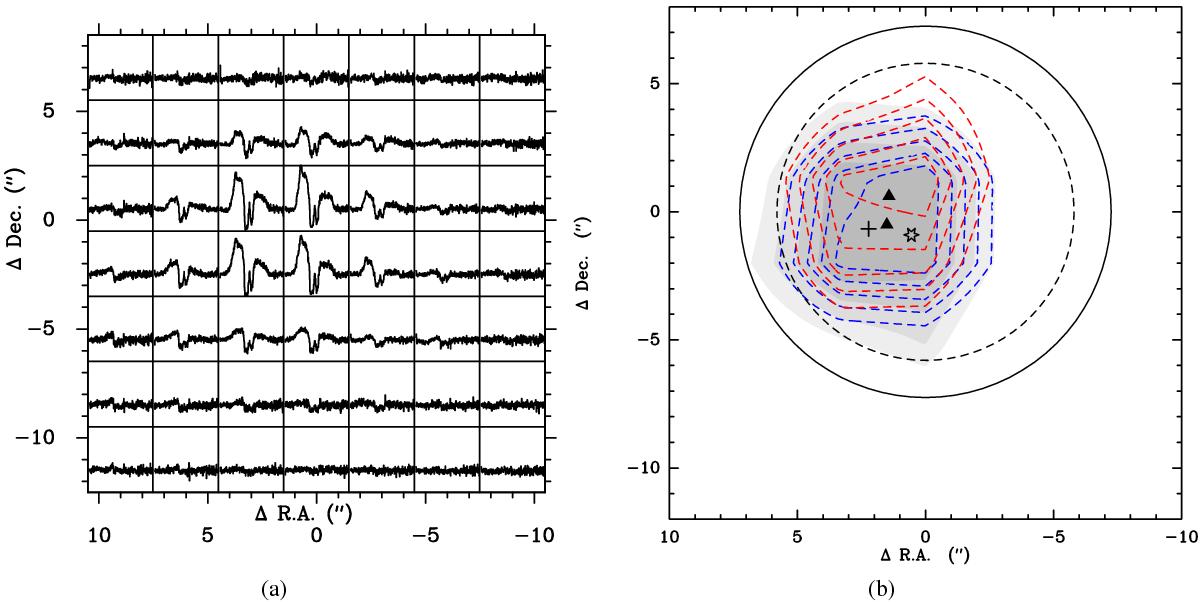
a) Continuum-subtracted spectral map of [OI]63μm line in G5.89–0.39. The velocity range shown in the spectra ranges from −60 km s-1 to +100 km s-1. The temperature scale ranges from −10 K to + 20 K. b) Map of the continuum emission at 63 μm. Red and blue contours represent the integrated red- and blue-shifted intensity of the [OI]63μm line. For the continuum emission and for the red- and blue-shifted integrated intensities levels are 50% of the peak intensity (9.0 K for the continuum, 187.5 K km s-1 for the red wing, 422.0 K km s-1 for the blue wing) in steps of 10%. The star indicates the position of Feldt’s star, the cross the peak of the SOFIA 63 μm continuum emission, the triangles are the peaks of the red- and blue-shifted [OI]63μm emission (Table 2). The solid and dashed circles represent the 14.̋5 beam of the CO(16–15) data and the 11.̋6 beam of the OH ground-state observations. In both panels the centre position is ![]() ,
, ![]() .
.
Current usage metrics show cumulative count of Article Views (full-text article views including HTML views, PDF and ePub downloads, according to the available data) and Abstracts Views on Vision4Press platform.
Data correspond to usage on the plateform after 2015. The current usage metrics is available 48-96 hours after online publication and is updated daily on week days.
Initial download of the metrics may take a while.