Fig. 2
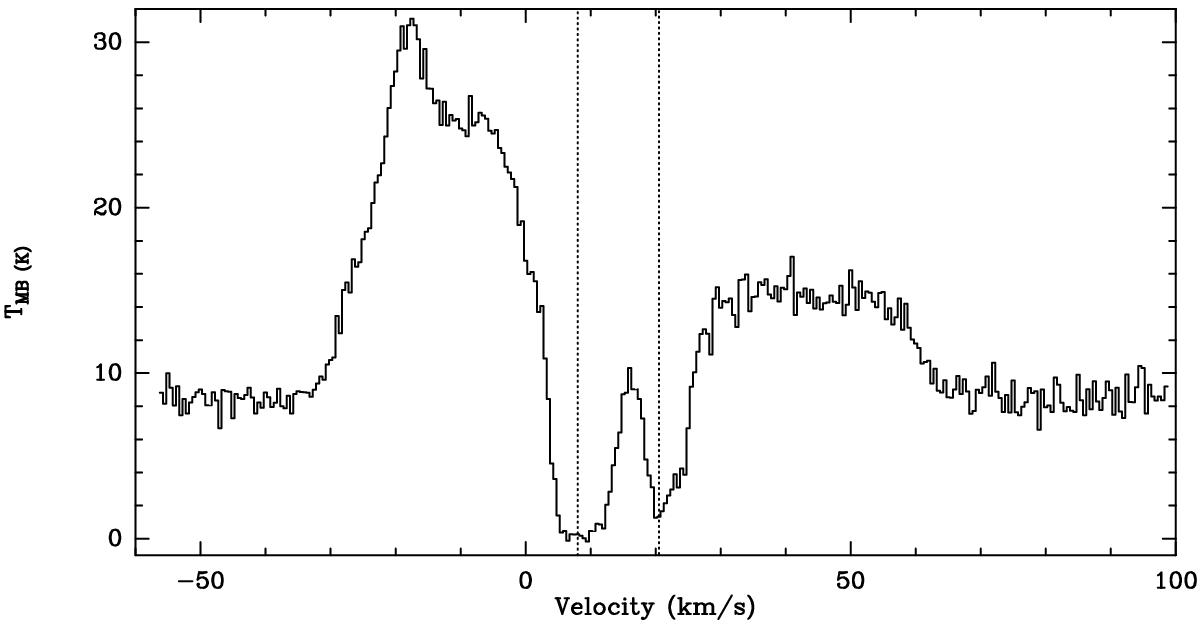
[OI]63μm spectrum at the original resolution (6.̋6) of the SOFIA data extracted from the strongest continuum position (0″, + 3″ from ![]() ,
, ![]() ). The left vertical dotted line shows the absorption features at 2–15 km s-1 that are due to the source itself and to a cold cloud along the line of sight at νLSR = 13.7 km s-1. The right dotted vertical line shows an additional line-of-sight absorption feature.
). The left vertical dotted line shows the absorption features at 2–15 km s-1 that are due to the source itself and to a cold cloud along the line of sight at νLSR = 13.7 km s-1. The right dotted vertical line shows an additional line-of-sight absorption feature.
Current usage metrics show cumulative count of Article Views (full-text article views including HTML views, PDF and ePub downloads, according to the available data) and Abstracts Views on Vision4Press platform.
Data correspond to usage on the plateform after 2015. The current usage metrics is available 48-96 hours after online publication and is updated daily on week days.
Initial download of the metrics may take a while.