Fig. 1
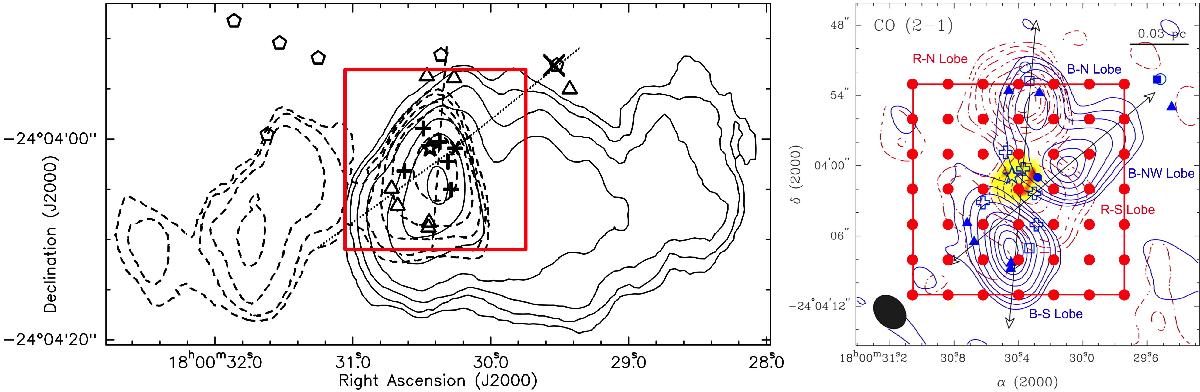
Overview (left) of the large scale east-west outflow and zoom (right) in the inner region powering the extremely high-velocity molecular outflows in CO(2–1) imaged with SMA from Su et al. (2012). The figures are adapted from Hunter et al. (2008) and Su et al. (2012). In the left panel, contours show the large-scale CO(1–0) outflow from Watson et al. (2007), pentagons are class I methanol masers (Kurtz et al. 2004), while crosses indicate the submillimetre-millimetre dust sources (Hunter et al. 2008). The dashed and dotted lines show the axes of the outflows detected at high velocities by Su et al. (2012). In the right panel, the red box delineates the region mapped in [OI]63μm; the red dots are the centres of the [OI]63μm raster map. The overlaid colour scale represents the cm free–free emission (Tang et al. 2009), filled triangles are the H2 knots, open circles are class I methanol maser positions, and open squares are positions of water masers (Hofner & Churchwell 1996). The crosses mark the position of the submillimetre-millimetre dust components. The ellipse shows the beam of the SMA observations from Su et al. (2012).
Current usage metrics show cumulative count of Article Views (full-text article views including HTML views, PDF and ePub downloads, according to the available data) and Abstracts Views on Vision4Press platform.
Data correspond to usage on the plateform after 2015. The current usage metrics is available 48-96 hours after online publication and is updated daily on week days.
Initial download of the metrics may take a while.