Fig. 11
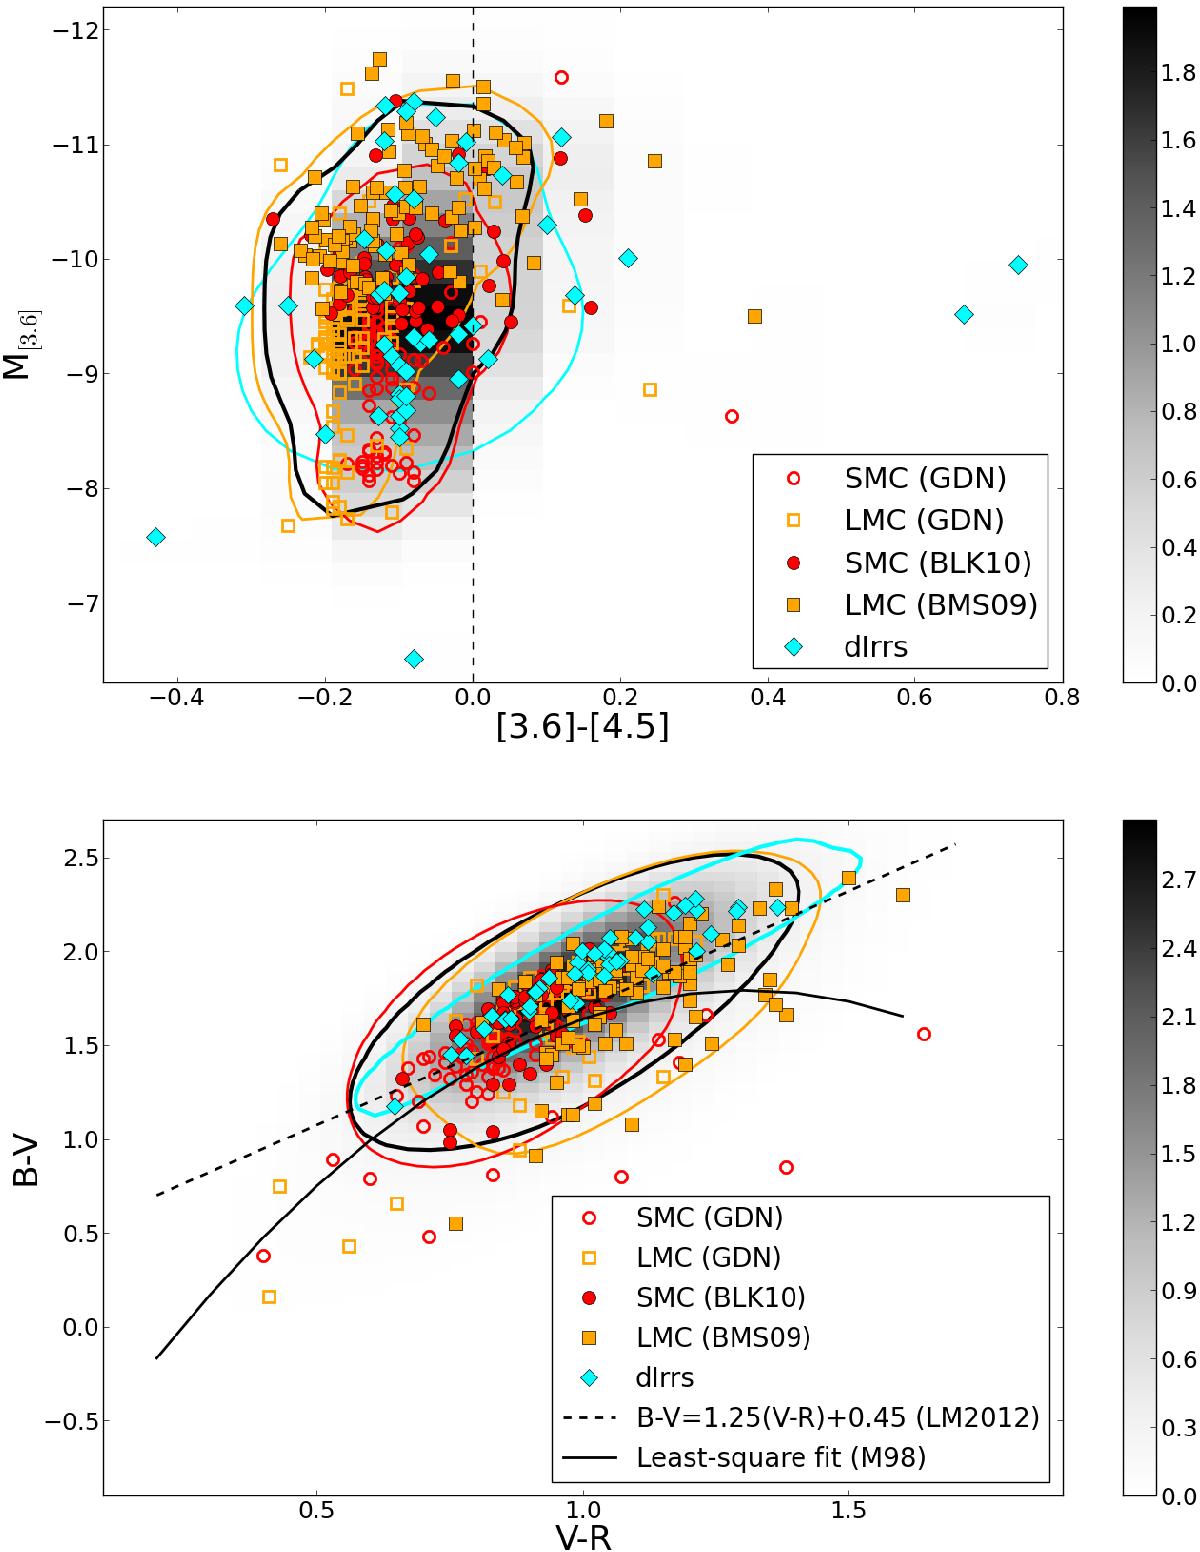
M[ 3.6 ] vs. [3.6]–[4.5] CMD (upper panel) and B − V vs. V − R diagram (lower panel) for spectroscopically confirmed RSGs in six Local Group dIrrs (Phoenix, Pegasus, Sextans A, WLM, IC 1613, and NGC 6822), the LMC, and the SMC. The RSGs from González-Fernández et al. (2015) are labeled “GDN”; RSGs labeled “BLK10” and “BMS09” are taken from Bonanos et al. (2010, 2009) respectively. The color contours correspond to a 1σ dispersion of the PDF for all RSGs for each galaxy, respectively. The black contour corresponds to a 1σ dispersion for the PDF of all RSGs in listed galaxies. The probability density function for all RSGs is highlighted in gray, the color bar corresponds to relative values of the PDF. The dashed line at [3.6]–[ 4.5 ] = 0 demarcates our selection criteria for identifying RSGs. The dashed line and the solid line in the two-color diagram have the same meaning as in Fig. 10. Optical photometry for RSGs in the Magellanic Clouds is adopted from Massey (2002).
Current usage metrics show cumulative count of Article Views (full-text article views including HTML views, PDF and ePub downloads, according to the available data) and Abstracts Views on Vision4Press platform.
Data correspond to usage on the plateform after 2015. The current usage metrics is available 48-96 hours after online publication and is updated daily on week days.
Initial download of the metrics may take a while.