Fig. 10
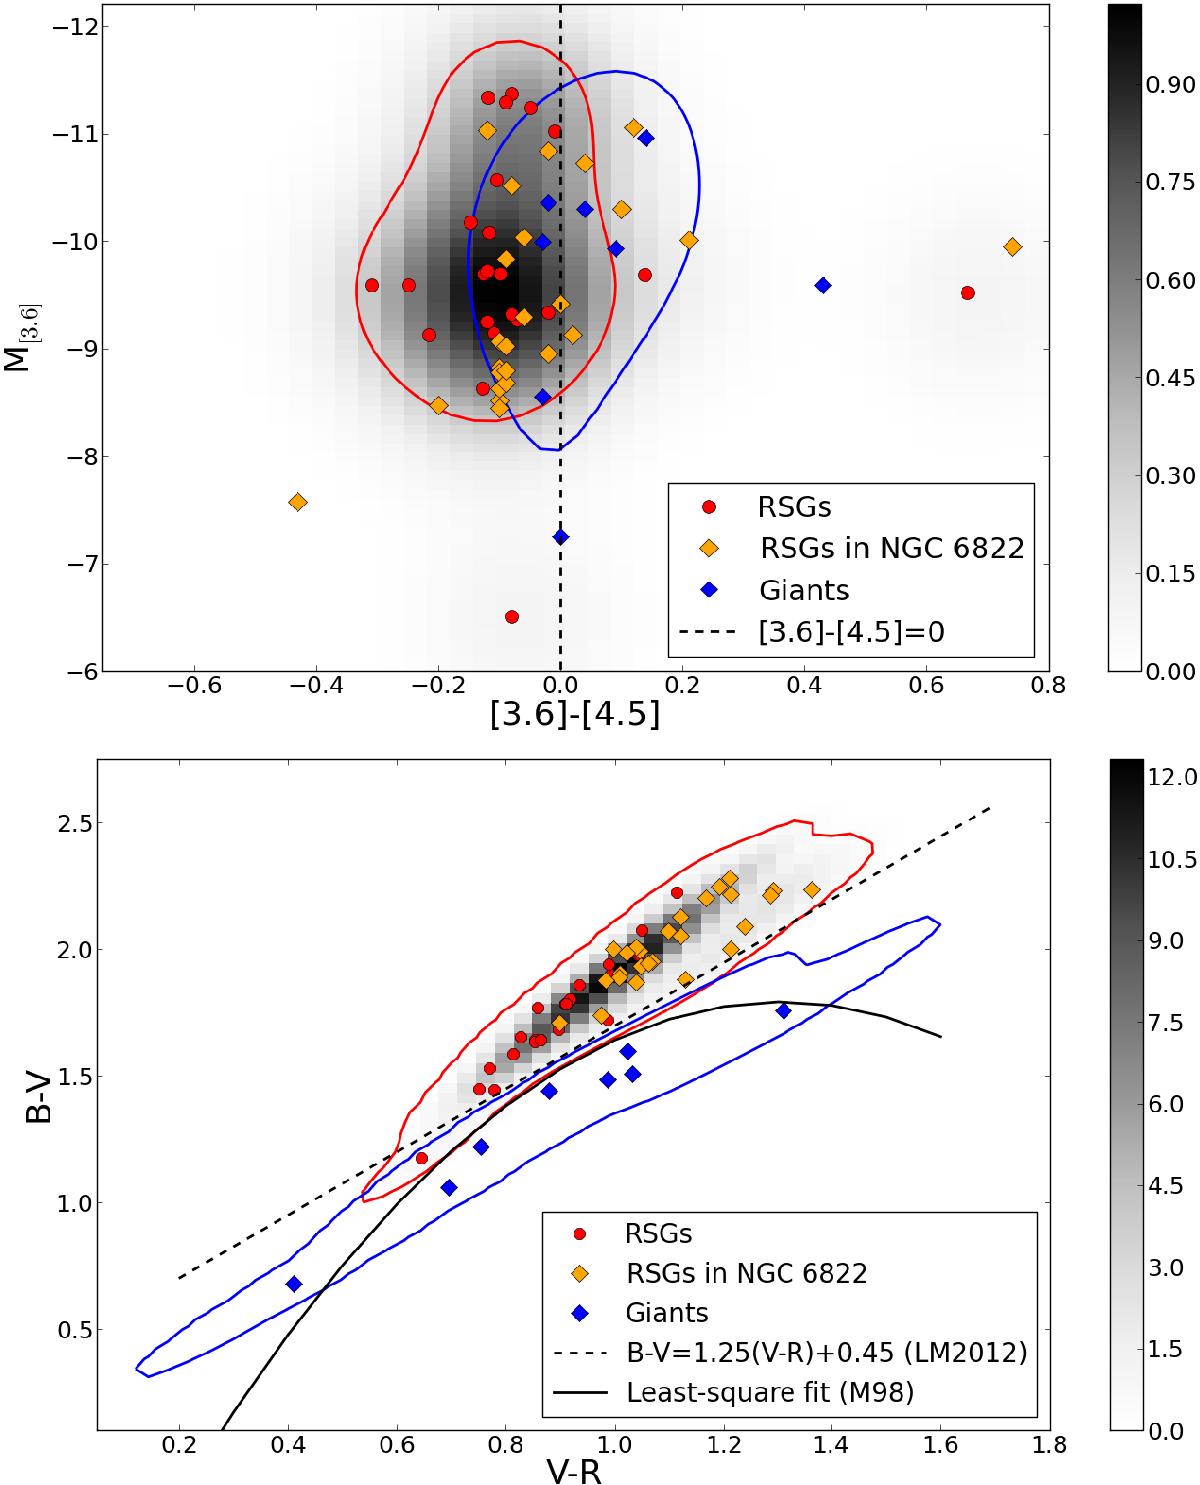
M[ 3.6 ] vs. [3.6]–[4.5] CMD (upper panel) and two-color optical diagram (lower panel) for all spectroscopically confirmed RSGs and giants in our four program galaxies, including known RSGs from the literature in WLM, NGC 6822, IC 1613, and Sextans A. RSGs in NGC 6822 are marked separately because of the different source mid-IR photometry. RSGs are indicated by red filled circles, giants by blue filled diamonds, and the color contours correspond to a 1σ dispersion of the Gaussian PDF. The probability density function for the whole sample of RSGs is shown in gray; the color bar corresponds to the relative value of the PDF. The dashed line at [3.6]–[ 4.5 ] = 0 demarcates our mid-IR selection criteria for identifying RSGs. The dashed line in the two-color diagram corresponds to the empirical dividing line that separates RSGs from foreground giant candidates defined in Levesque & Massey (2012). The solid line corresponds to a least-squares fit model of separating RSG candidates from foreground candidates, provided in Massey (1998).
Current usage metrics show cumulative count of Article Views (full-text article views including HTML views, PDF and ePub downloads, according to the available data) and Abstracts Views on Vision4Press platform.
Data correspond to usage on the plateform after 2015. The current usage metrics is available 48-96 hours after online publication and is updated daily on week days.
Initial download of the metrics may take a while.