Fig. 1
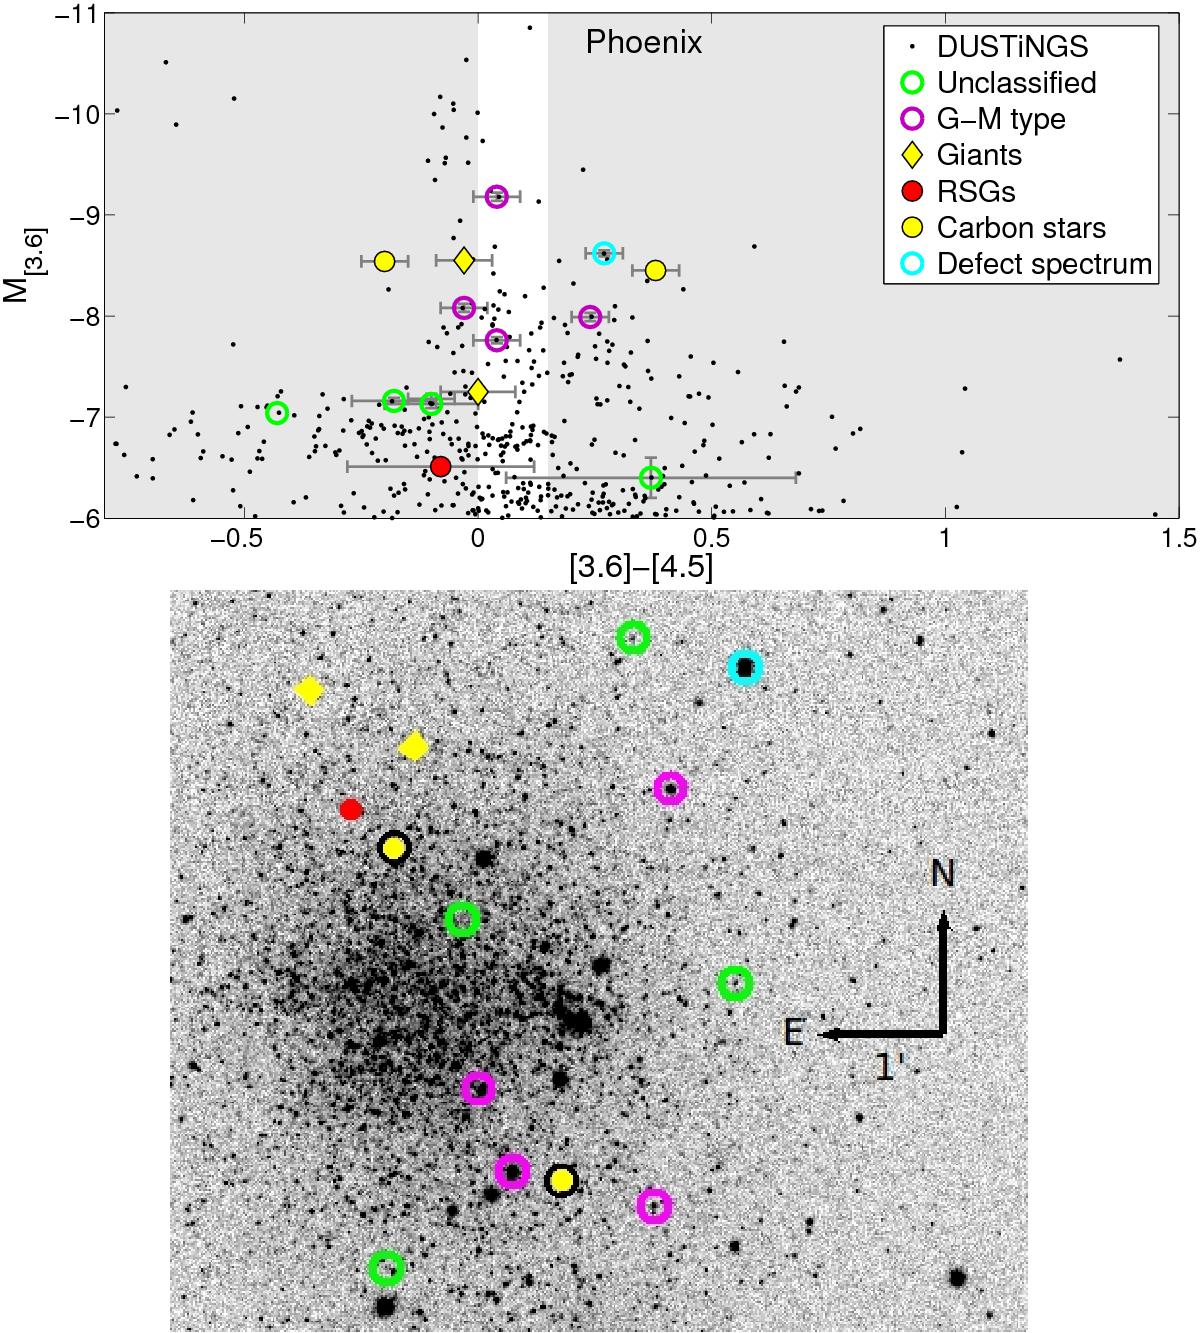
Top panel: M[ 3.6 ] vs. [3.6]–[4.5] CMD for the Phoenix dIrr galaxy. The stars that we observed are indicated by different symbols according to their classification, given in Table A.1 as explained in the legend. For each target on the CMD we indicate the error bars for the colors and magnitudes by gray lines. The regions that satisfy our selection criteria are highlighted in light gray (the left region corresponds to the RSGs area, the right region corresponds to the LBVs and sgB[e] area, see text for more details). Bottom panel: the spatial distribution of the observed targets, superposed on V-band images of the Phoenix galaxy (Massey et al. 2007c).
Current usage metrics show cumulative count of Article Views (full-text article views including HTML views, PDF and ePub downloads, according to the available data) and Abstracts Views on Vision4Press platform.
Data correspond to usage on the plateform after 2015. The current usage metrics is available 48-96 hours after online publication and is updated daily on week days.
Initial download of the metrics may take a while.