Fig. 4
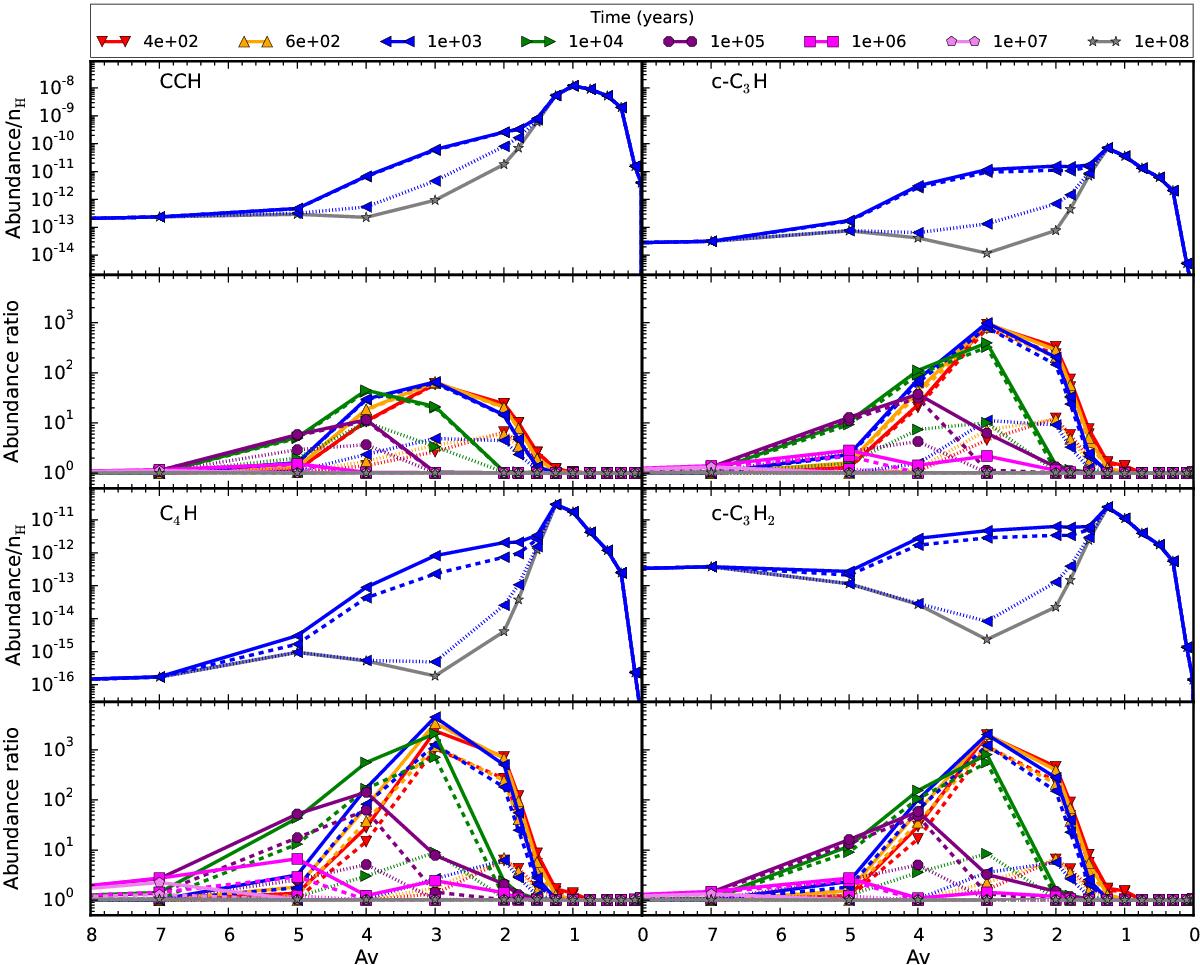
Output of the Horsehead Nebula photon dominated region time dependent model for observed selected hydrocarbons (CCH, c-C3H, c-C3H2, C4H). The abundances are shown as a function of visual extinction in the cloud illuminated by the σOri star (see Appendix A for details) and time. For each species the upper panel shows the abundance at time 103 yr (close to the maximum injection by dust grains, for clarity): initial model without hydrogenated amorphous carbon photolysis (lower curve), with model I including reactions up to CH4 (dotted line), model II reactions up to C2Hy (dashed line), model III reactions up to C3Hy (upper curve). For each species, in the lower panel, the corresponding abundance ratio with the addition of photolytic reactions over the abundance without the addition of the photolytic reactions is shown for all times.
Current usage metrics show cumulative count of Article Views (full-text article views including HTML views, PDF and ePub downloads, according to the available data) and Abstracts Views on Vision4Press platform.
Data correspond to usage on the plateform after 2015. The current usage metrics is available 48-96 hours after online publication and is updated daily on week days.
Initial download of the metrics may take a while.