Free Access
Fig. 3
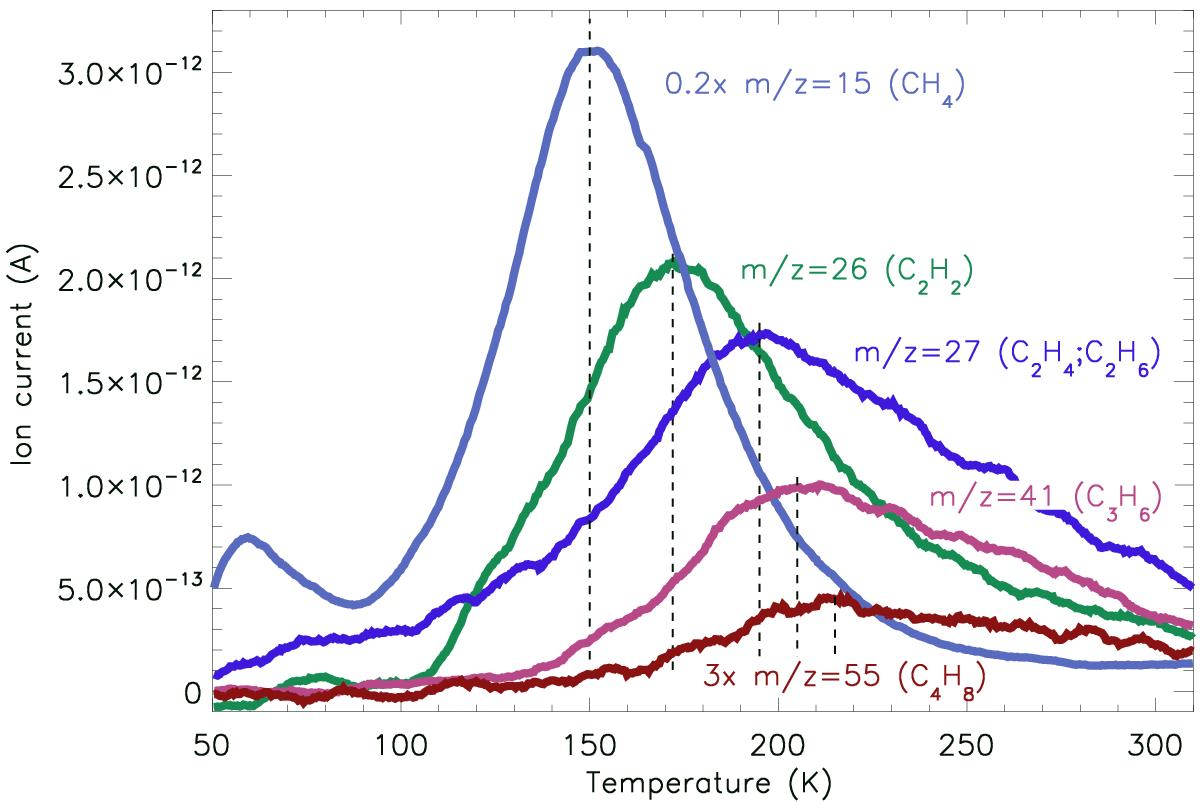
TPD spectra recorded for selected m/z for the a–C:H experiment. The chosen masses are dominated by a small amount of fragments contributing to the signal. The corresponding parent species are given in brackets, as obtained from the minimization. The desorption temperature peaks are indicated by vertical dashed lines.
Current usage metrics show cumulative count of Article Views (full-text article views including HTML views, PDF and ePub downloads, according to the available data) and Abstracts Views on Vision4Press platform.
Data correspond to usage on the plateform after 2015. The current usage metrics is available 48-96 hours after online publication and is updated daily on week days.
Initial download of the metrics may take a while.