Fig. 1
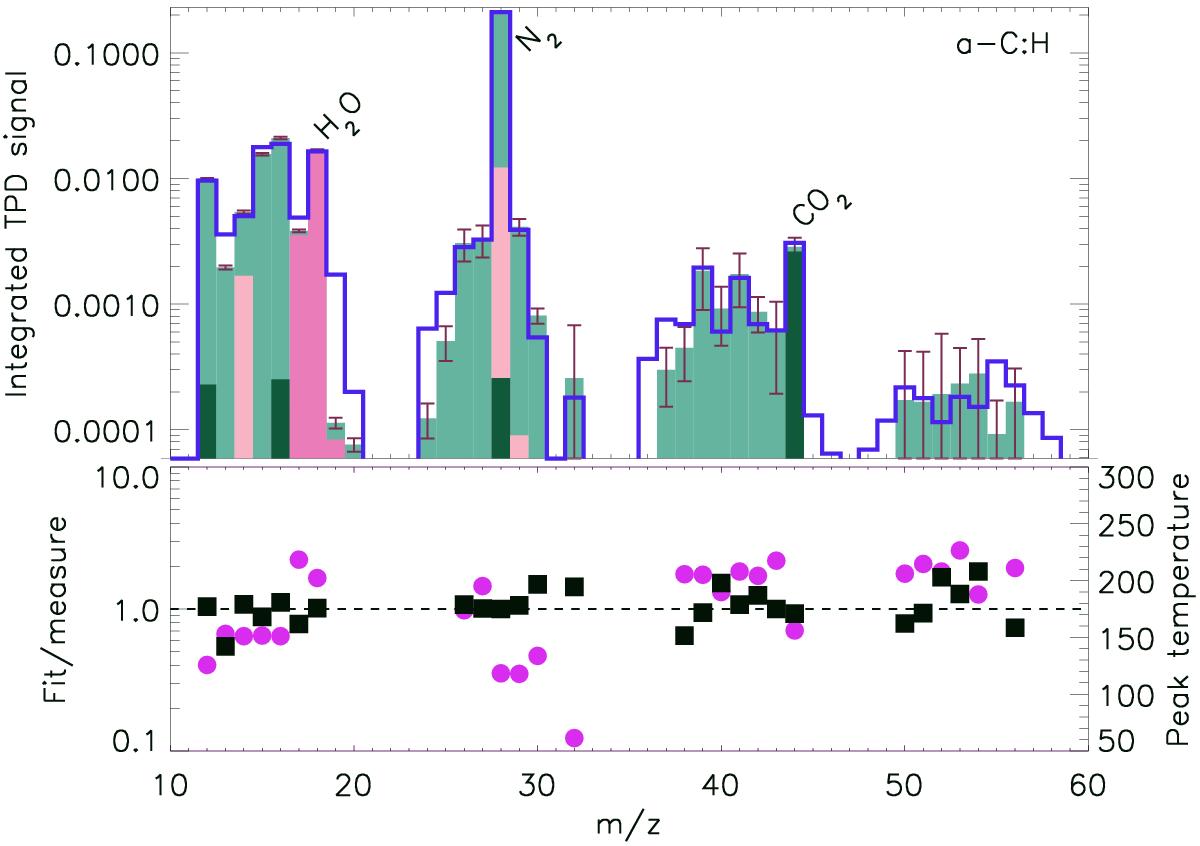
Top: QMS integrated signal recorded during the TPD of an irradiated a–C:H film (blue histogram). The synthetic mass spectrum obtained by a matrix analysis is shown with filled bar graphs; the associated error bars come from the minimization procedure. Bottom: ratio of the fitted versus measured individual mass spectra for the main peaks (left axis, squares), and peak temperature associated with the TPD for the considered mass (right axis, circles).
Current usage metrics show cumulative count of Article Views (full-text article views including HTML views, PDF and ePub downloads, according to the available data) and Abstracts Views on Vision4Press platform.
Data correspond to usage on the plateform after 2015. The current usage metrics is available 48-96 hours after online publication and is updated daily on week days.
Initial download of the metrics may take a while.