Fig. 7
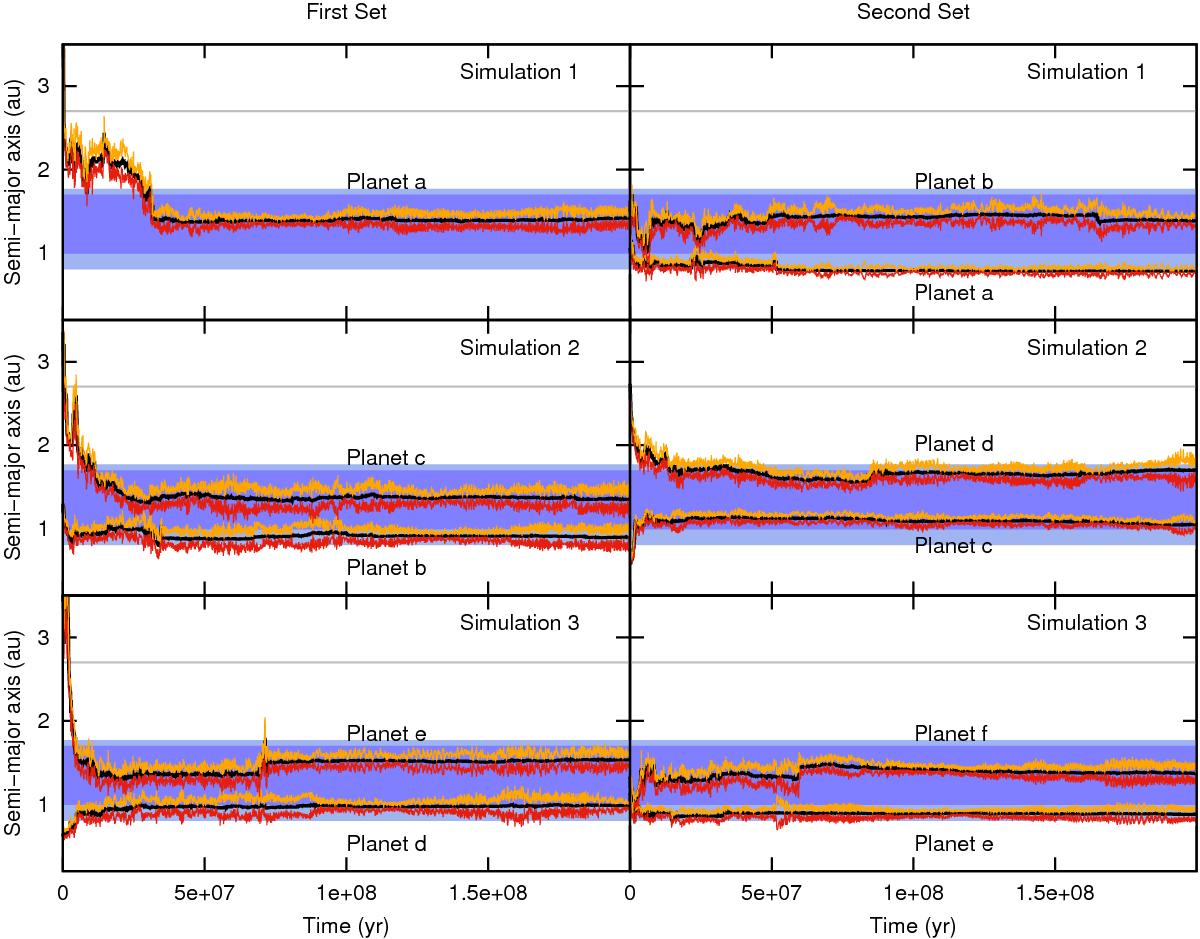
Evolution in time of the semi-major axis (black), the perihelion (red), and the aphelion (orange) of the planets that remain within the HZ of each simulation in both the first (left panel) and the second set (right panel) of simulations. The blue and light-blue shaded areas represent the conservative and the optimistic HZ, and the dashed gray line represents the position of the snow line. A color figure is available in the electronic version.
Current usage metrics show cumulative count of Article Views (full-text article views including HTML views, PDF and ePub downloads, according to the available data) and Abstracts Views on Vision4Press platform.
Data correspond to usage on the plateform after 2015. The current usage metrics is available 48-96 hours after online publication and is updated daily on week days.
Initial download of the metrics may take a while.