Free Access
Fig. 5
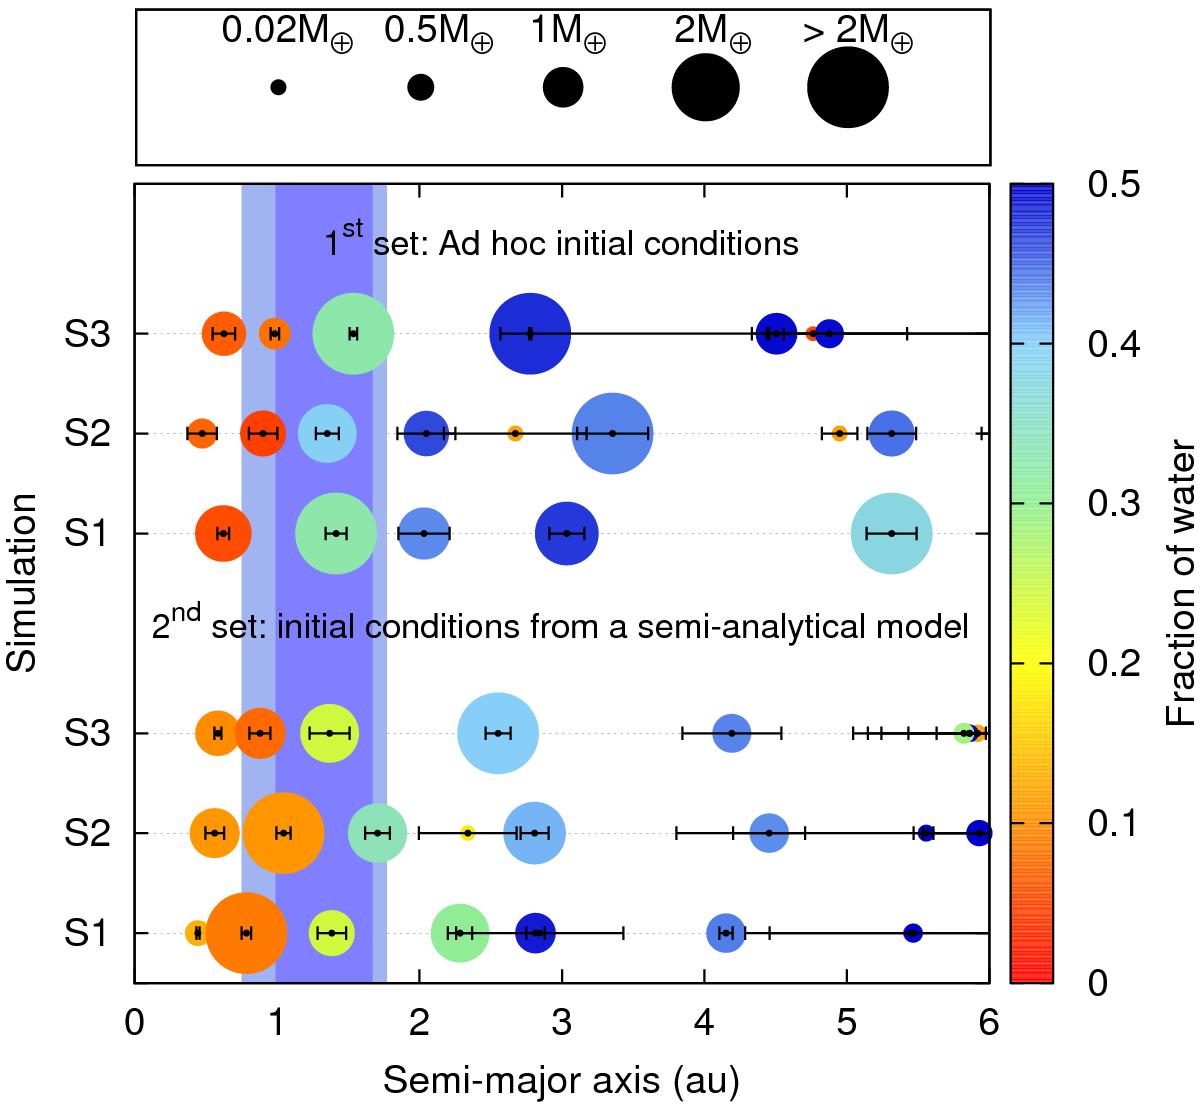
Final configuration of the first and second set of simulations. The color scale represents the water content and the shaded regions, the optimistic and the conservative HZ. The eccentricity of each planet is shown above it, by its radial movement over an orbit. A color figure is available in the electronic version.
Current usage metrics show cumulative count of Article Views (full-text article views including HTML views, PDF and ePub downloads, according to the available data) and Abstracts Views on Vision4Press platform.
Data correspond to usage on the plateform after 2015. The current usage metrics is available 48-96 hours after online publication and is updated daily on week days.
Initial download of the metrics may take a while.