Fig. 2
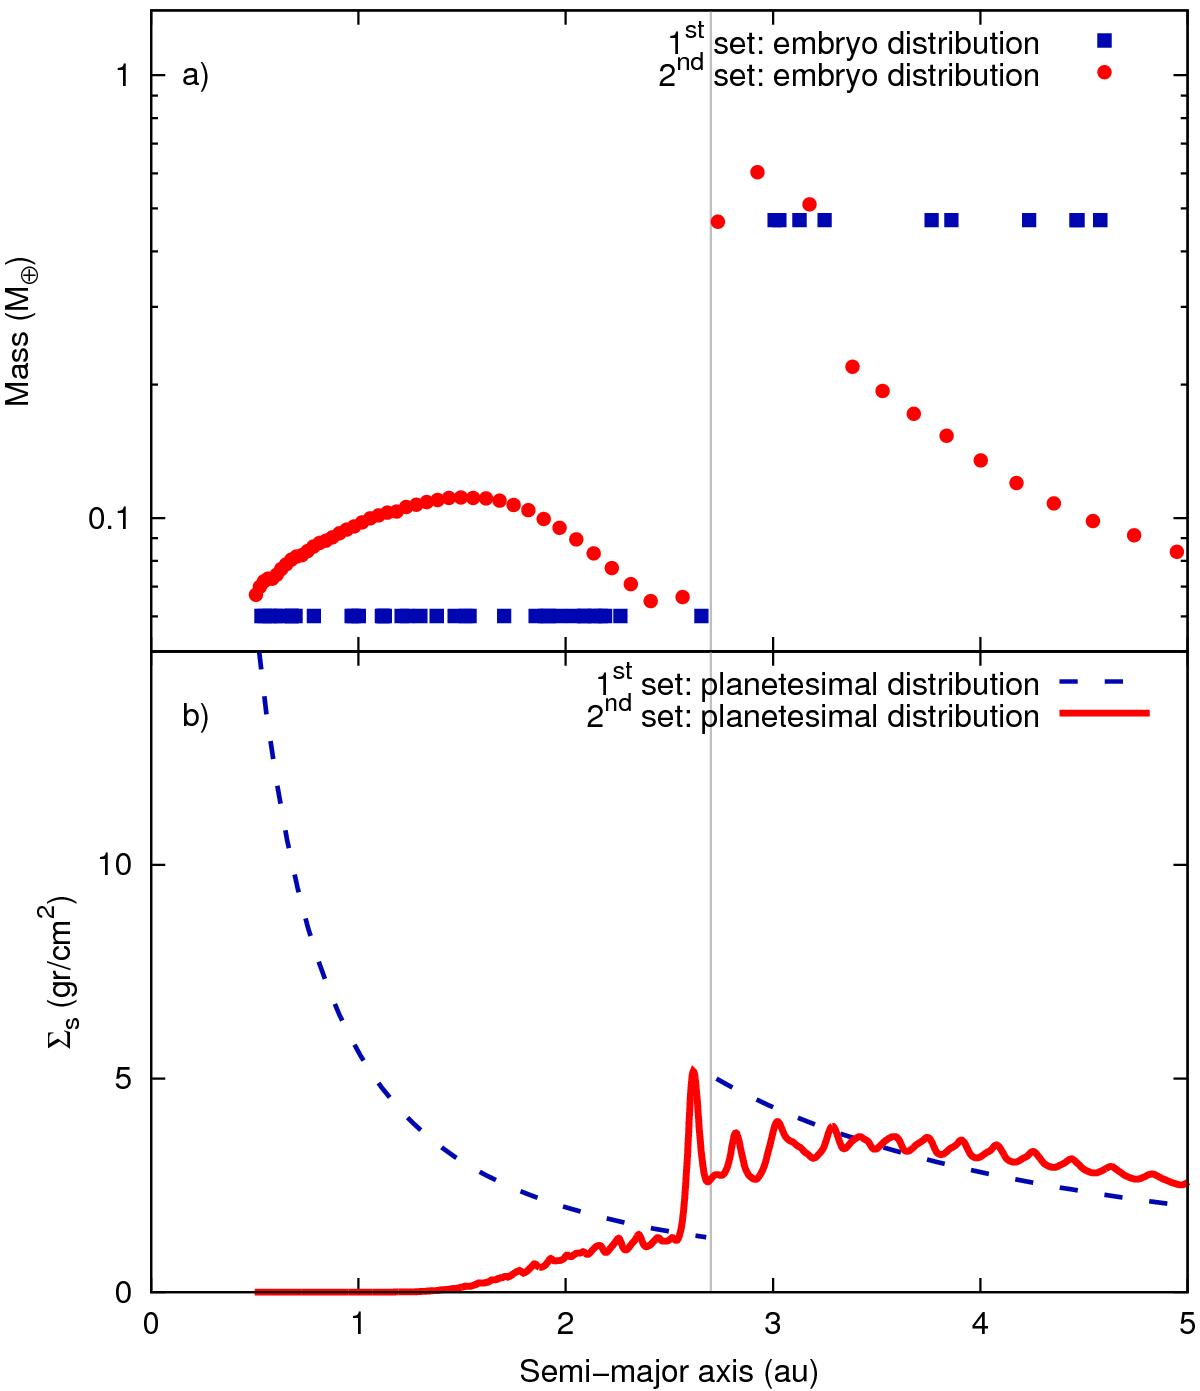
a) Distributions of embryos used to start the N-body simulations. The squares represent the distribution of embryos obtained with the first set of simulations. The circles represent the final results obtained with the semi-analytical model (the second set of simulations). b) Surface density profiles used to distribute 1000 planetesimals to start the N-body simulations. The dashed line represents the surface density for the first set, the solid line the surface density for the second set obtained with the semi-analytical model. A color figure is available in the electronic version.
Current usage metrics show cumulative count of Article Views (full-text article views including HTML views, PDF and ePub downloads, according to the available data) and Abstracts Views on Vision4Press platform.
Data correspond to usage on the plateform after 2015. The current usage metrics is available 48-96 hours after online publication and is updated daily on week days.
Initial download of the metrics may take a while.