Fig. 1
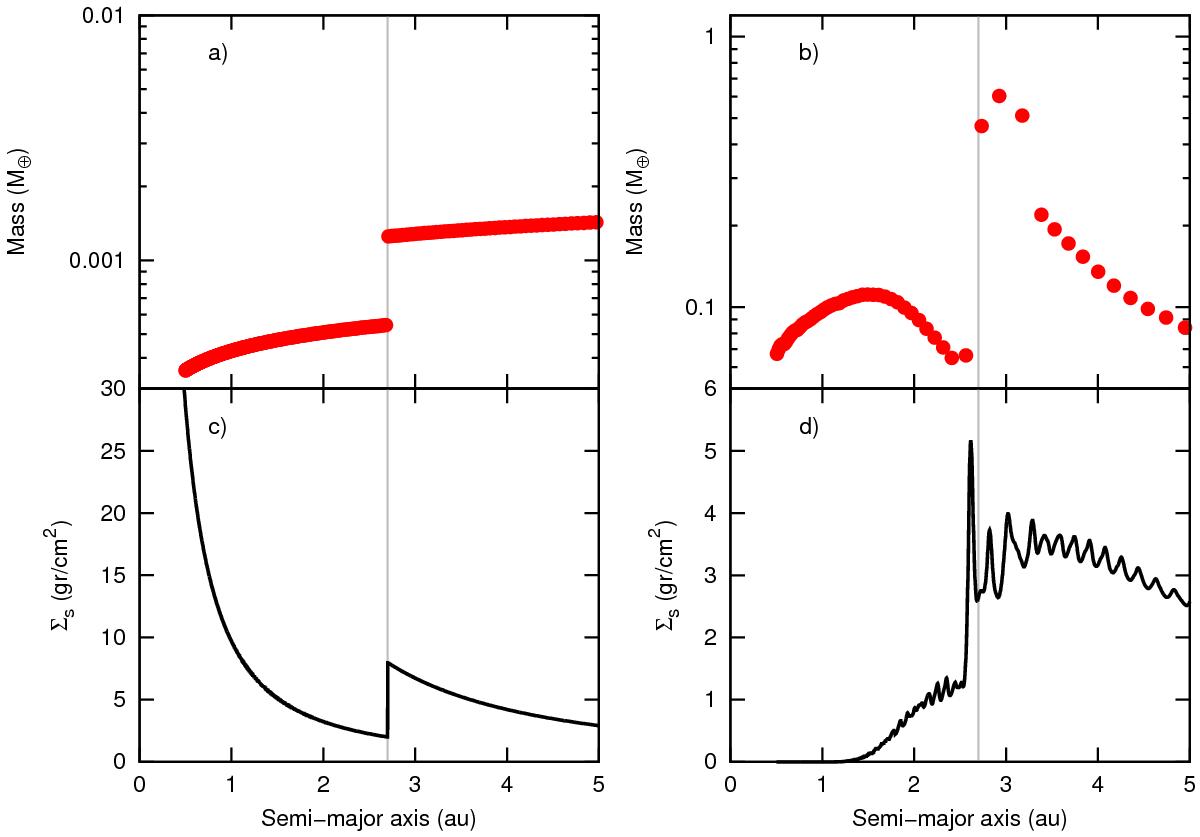
Initial and final distributions of embryos and planetesimals generated by the semi-analytical model. Panels a) and b) represent the initial and final mass distribution of embryos. At the beginning a) there were 223 embryos between 0.5 au and 5 au, and after 3 Myr of evolution b) there only remain 57 embryos. Panels c) and d) represent the initial and final density profile of planetesimals. Panels b) and d) then represent the final results obtained with the semi-analytical model after 3 Myr of evolution and the initial conditions for the N-body simulations. The vertical lines in gray represent the position of the snow line at 2.7 au. A color figure is available in the electronic version.
Current usage metrics show cumulative count of Article Views (full-text article views including HTML views, PDF and ePub downloads, according to the available data) and Abstracts Views on Vision4Press platform.
Data correspond to usage on the plateform after 2015. The current usage metrics is available 48-96 hours after online publication and is updated daily on week days.
Initial download of the metrics may take a while.