Free Access
Fig. 8
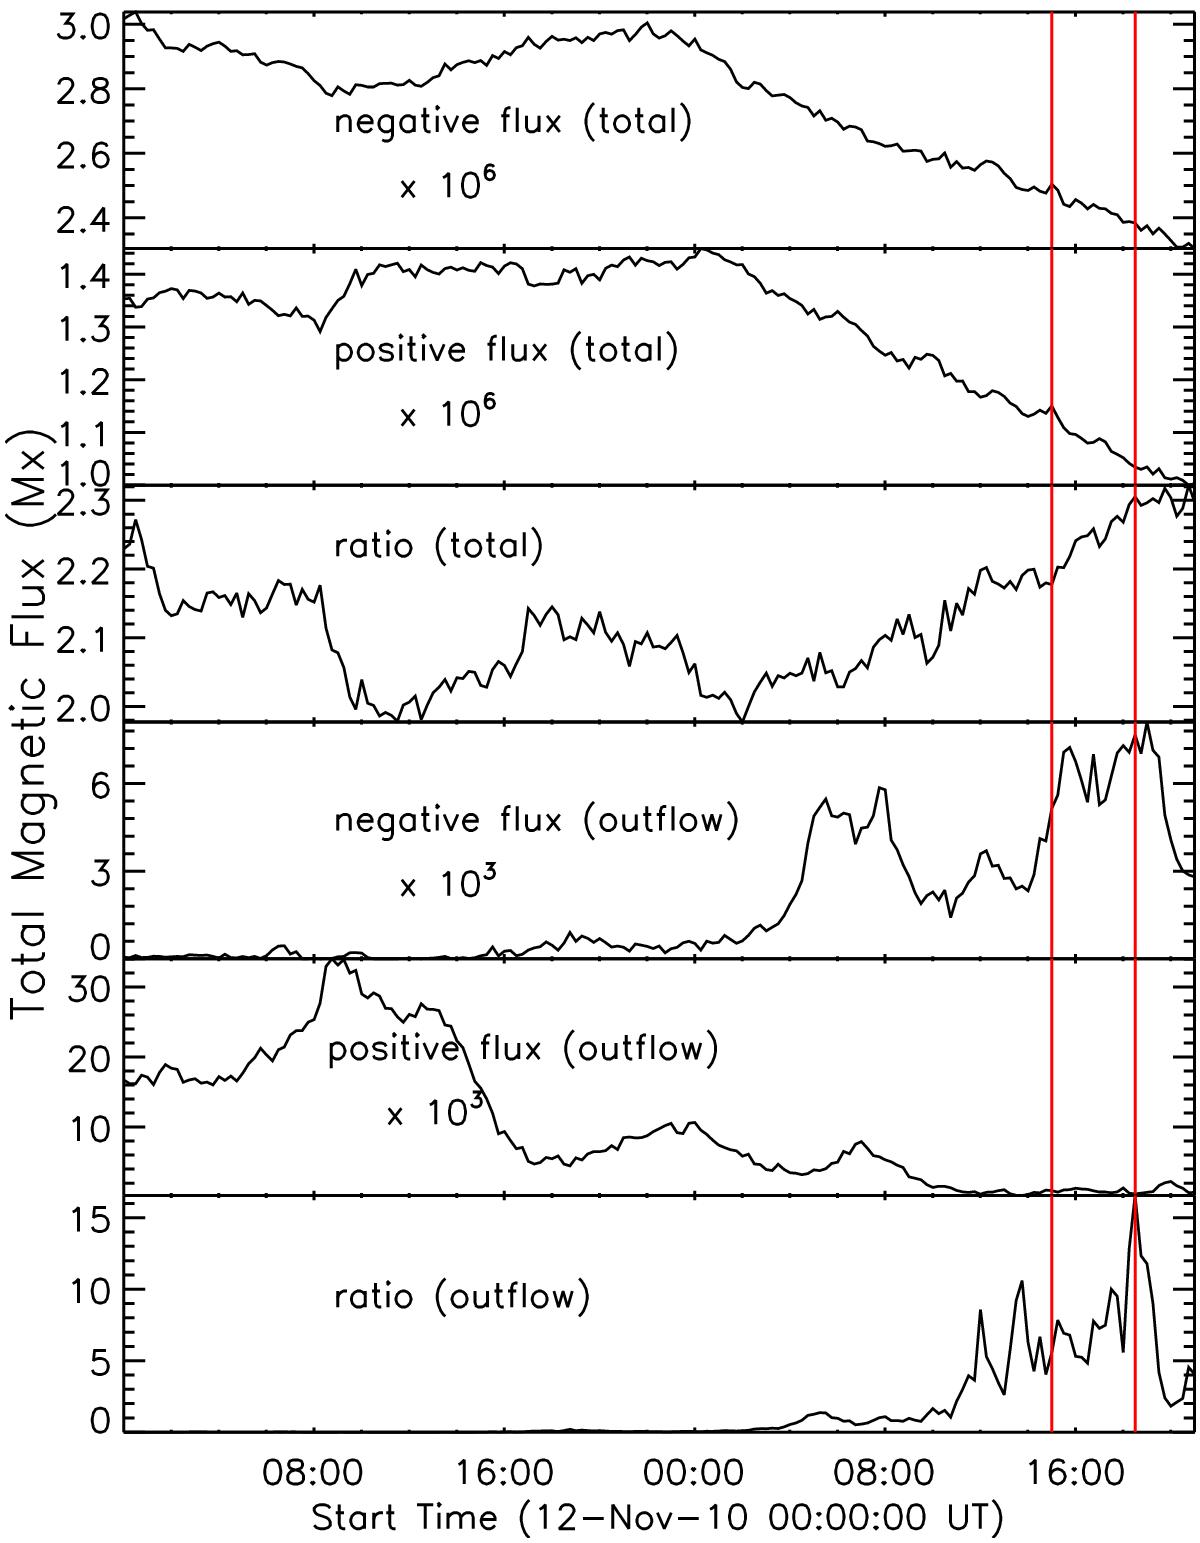
Time evolution of the absolute magnetic flux of each polarity within the full FOV (top three panels) shown in Fig. 7 and within the region enclosed by the red dashed line (bottom three panels) in the same figure. The vertical lines denote the period during which EIS observations are available.
Current usage metrics show cumulative count of Article Views (full-text article views including HTML views, PDF and ePub downloads, according to the available data) and Abstracts Views on Vision4Press platform.
Data correspond to usage on the plateform after 2015. The current usage metrics is available 48-96 hours after online publication and is updated daily on week days.
Initial download of the metrics may take a while.