Free Access
Fig. 7
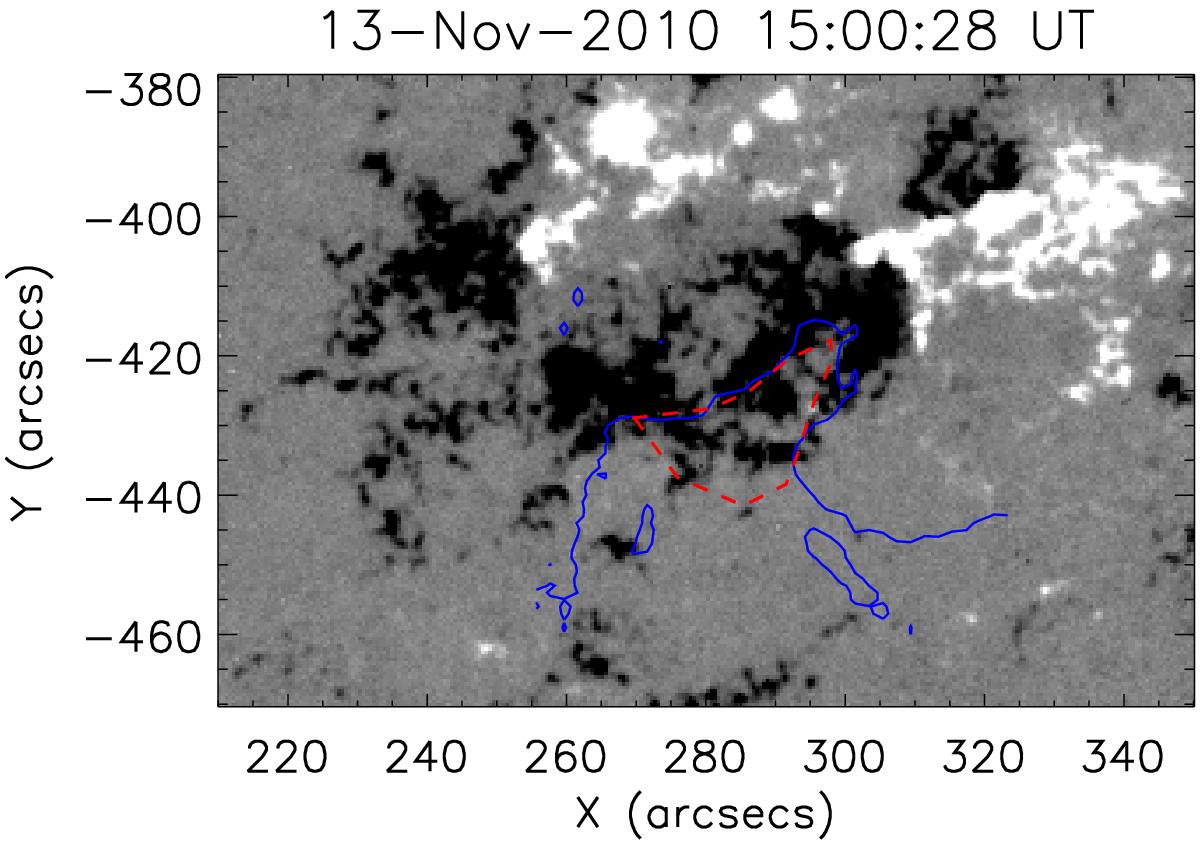
HMI magnetogram taken on 13 November 2010 at 15:00 UT with the contours of the EIS upflow region derived from the EIS big raster (shown in Fig. 2, right) marked in solid blue. The area bounded by the red dashed line is the footpoints of the upflows and was used for the study of the magnetic flux evolution shown in Fig. 8.
Current usage metrics show cumulative count of Article Views (full-text article views including HTML views, PDF and ePub downloads, according to the available data) and Abstracts Views on Vision4Press platform.
Data correspond to usage on the plateform after 2015. The current usage metrics is available 48-96 hours after online publication and is updated daily on week days.
Initial download of the metrics may take a while.