Free Access
Fig. 6
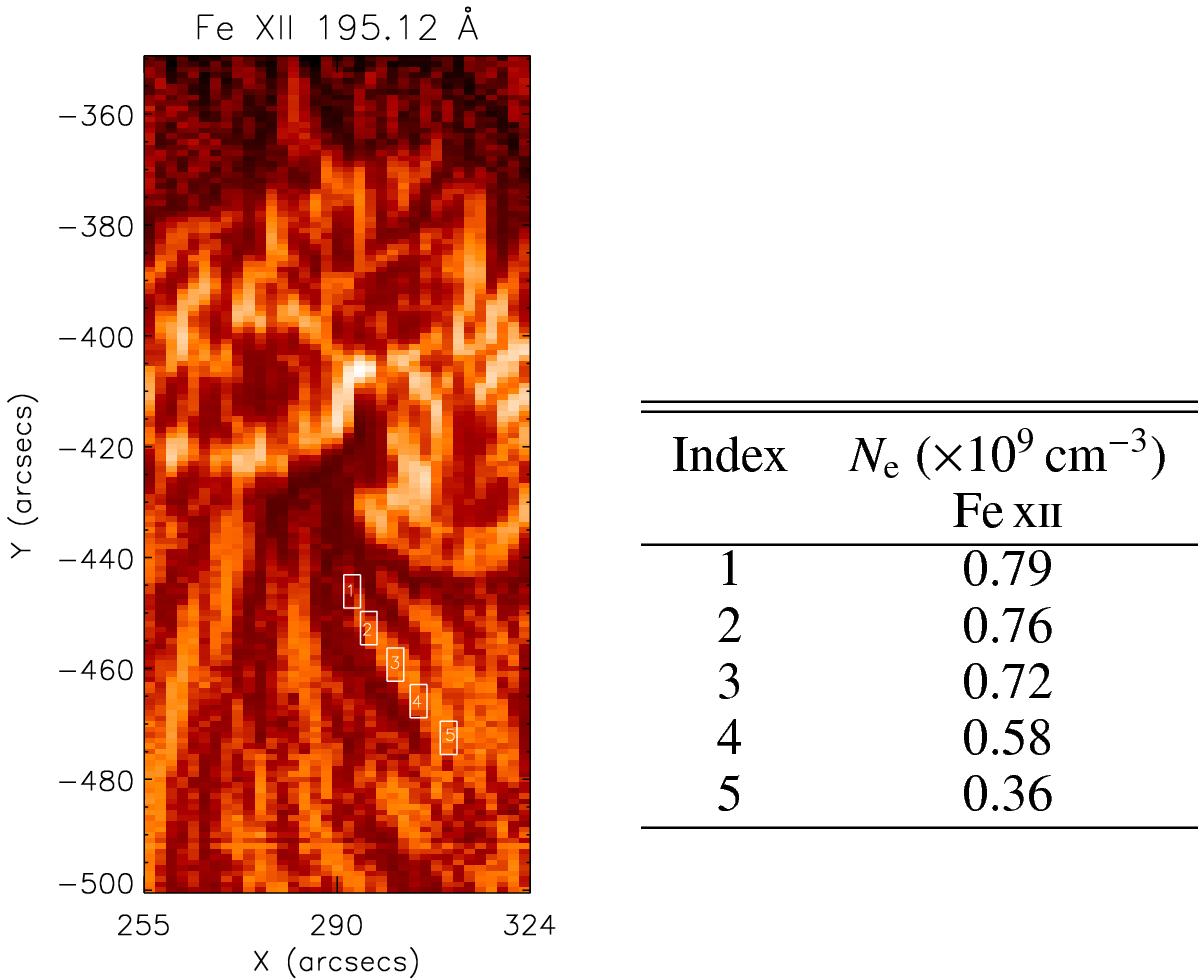
Left: MGN enhanced EIS Fe xii 195.12 Å image of the upflow region. Boxes are marked along one of the quasi-open loops. Right: densities of the boxed regions as calculated from the Fe xii line ratio.
Current usage metrics show cumulative count of Article Views (full-text article views including HTML views, PDF and ePub downloads, according to the available data) and Abstracts Views on Vision4Press platform.
Data correspond to usage on the plateform after 2015. The current usage metrics is available 48-96 hours after online publication and is updated daily on week days.
Initial download of the metrics may take a while.