Free Access
Fig. 2
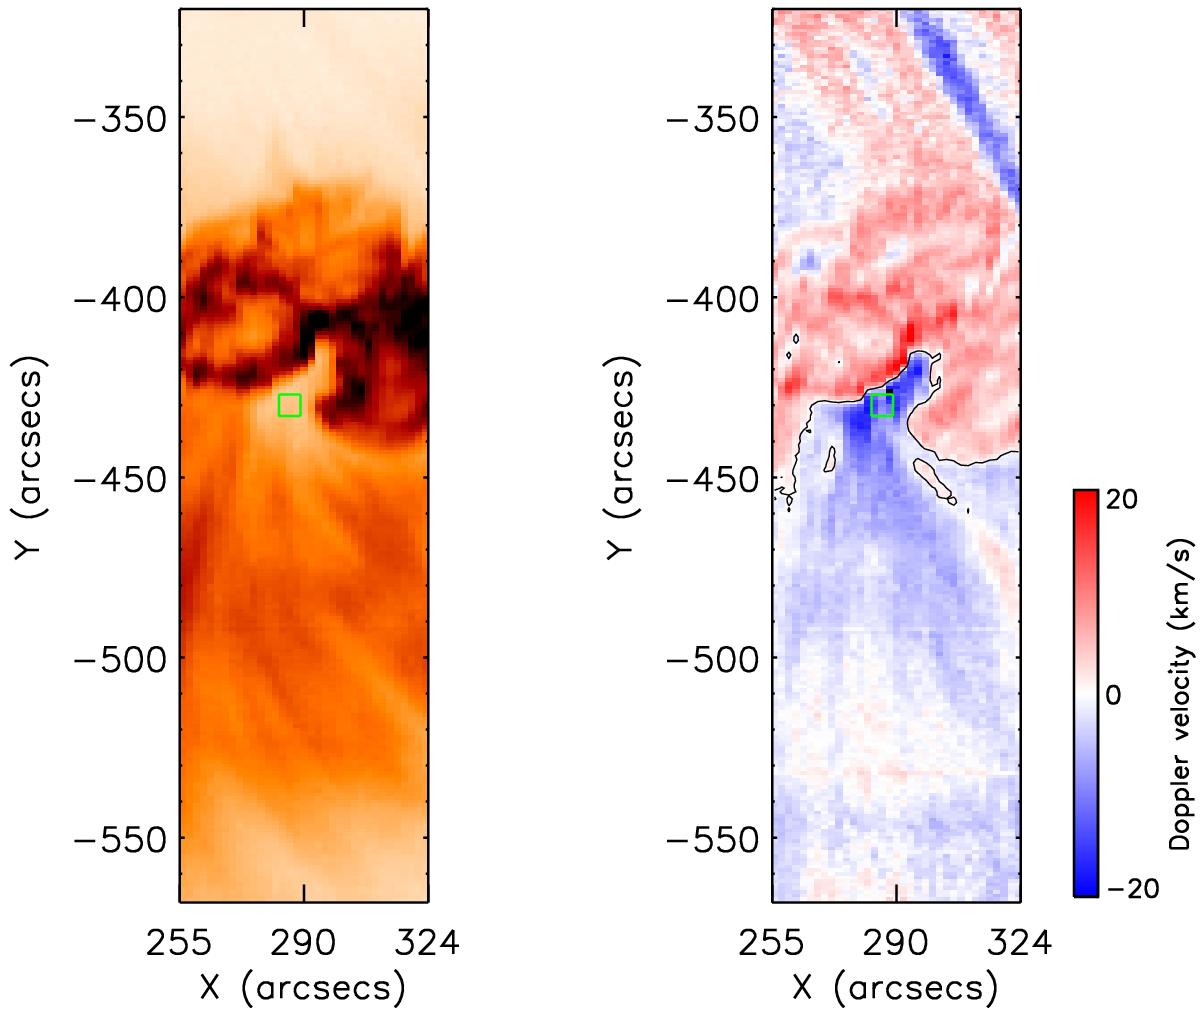
EIS Fe xii 195.12 Å intensity (left, in reverse colour table) and corresponding Doppler velocity (right) images taken starting at 15:02 UT. The black contour line in the velocity image follows pixels with zero Doppler-shift. The green box indicates the region we have selected for further analysis.
Current usage metrics show cumulative count of Article Views (full-text article views including HTML views, PDF and ePub downloads, according to the available data) and Abstracts Views on Vision4Press platform.
Data correspond to usage on the plateform after 2015. The current usage metrics is available 48-96 hours after online publication and is updated daily on week days.
Initial download of the metrics may take a while.