Free Access
Fig. A.3
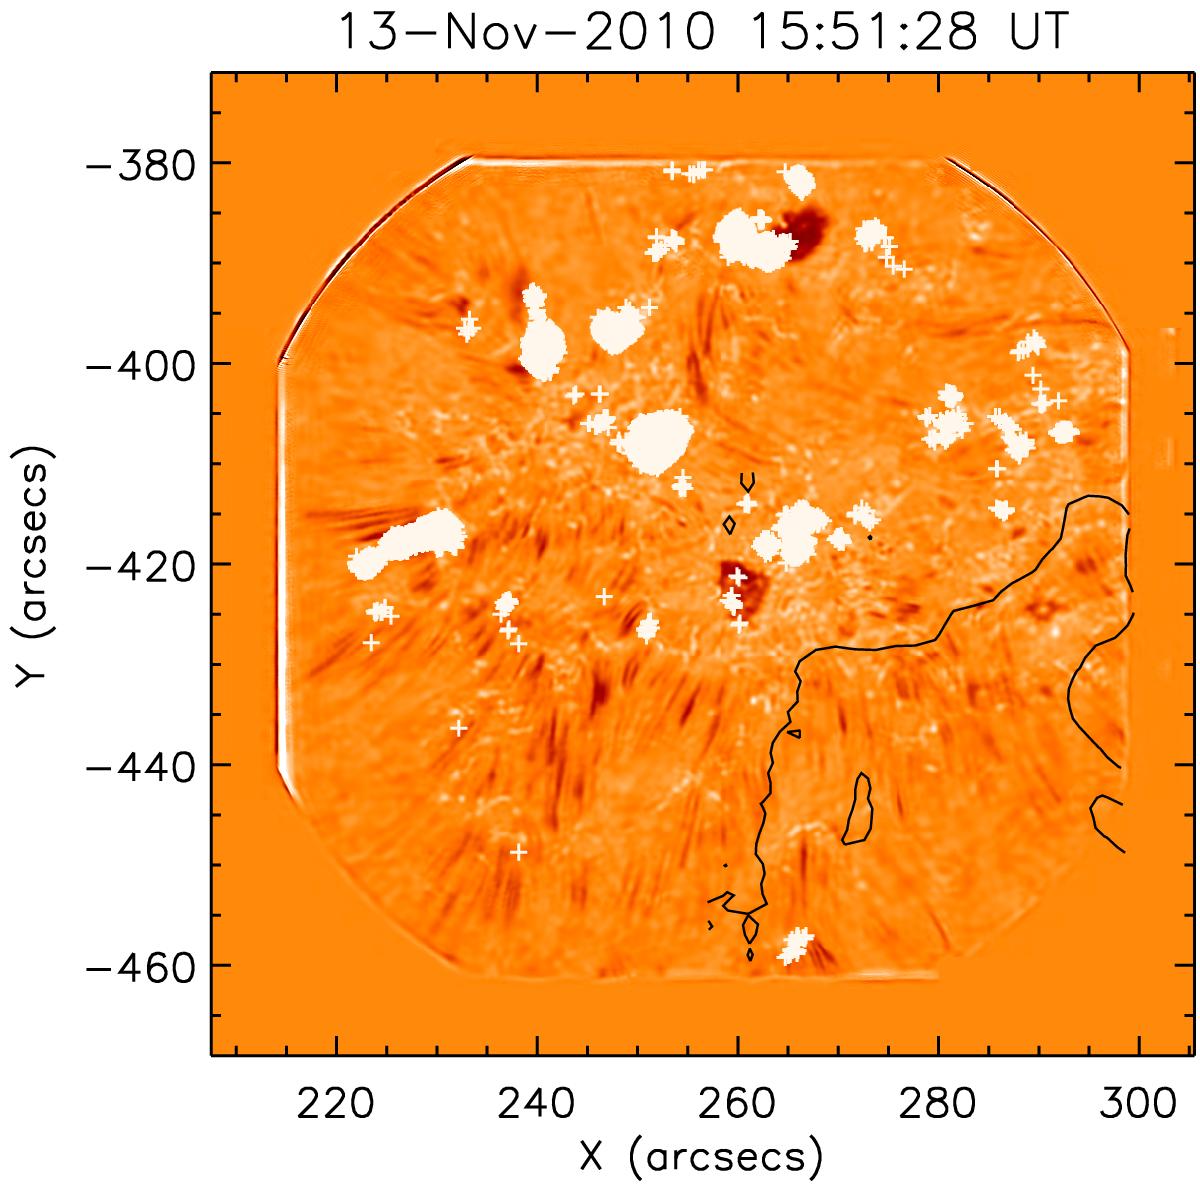
Animation of IBIS images taken in the blue wing of the Hα line with the contour of the upflow region superimposed in black. The white patches represent locations of blueward asymmetry detected in this dataset. The associated movie is available online.
Current usage metrics show cumulative count of Article Views (full-text article views including HTML views, PDF and ePub downloads, according to the available data) and Abstracts Views on Vision4Press platform.
Data correspond to usage on the plateform after 2015. The current usage metrics is available 48-96 hours after online publication and is updated daily on week days.
Initial download of the metrics may take a while.