Free Access
Fig. 10
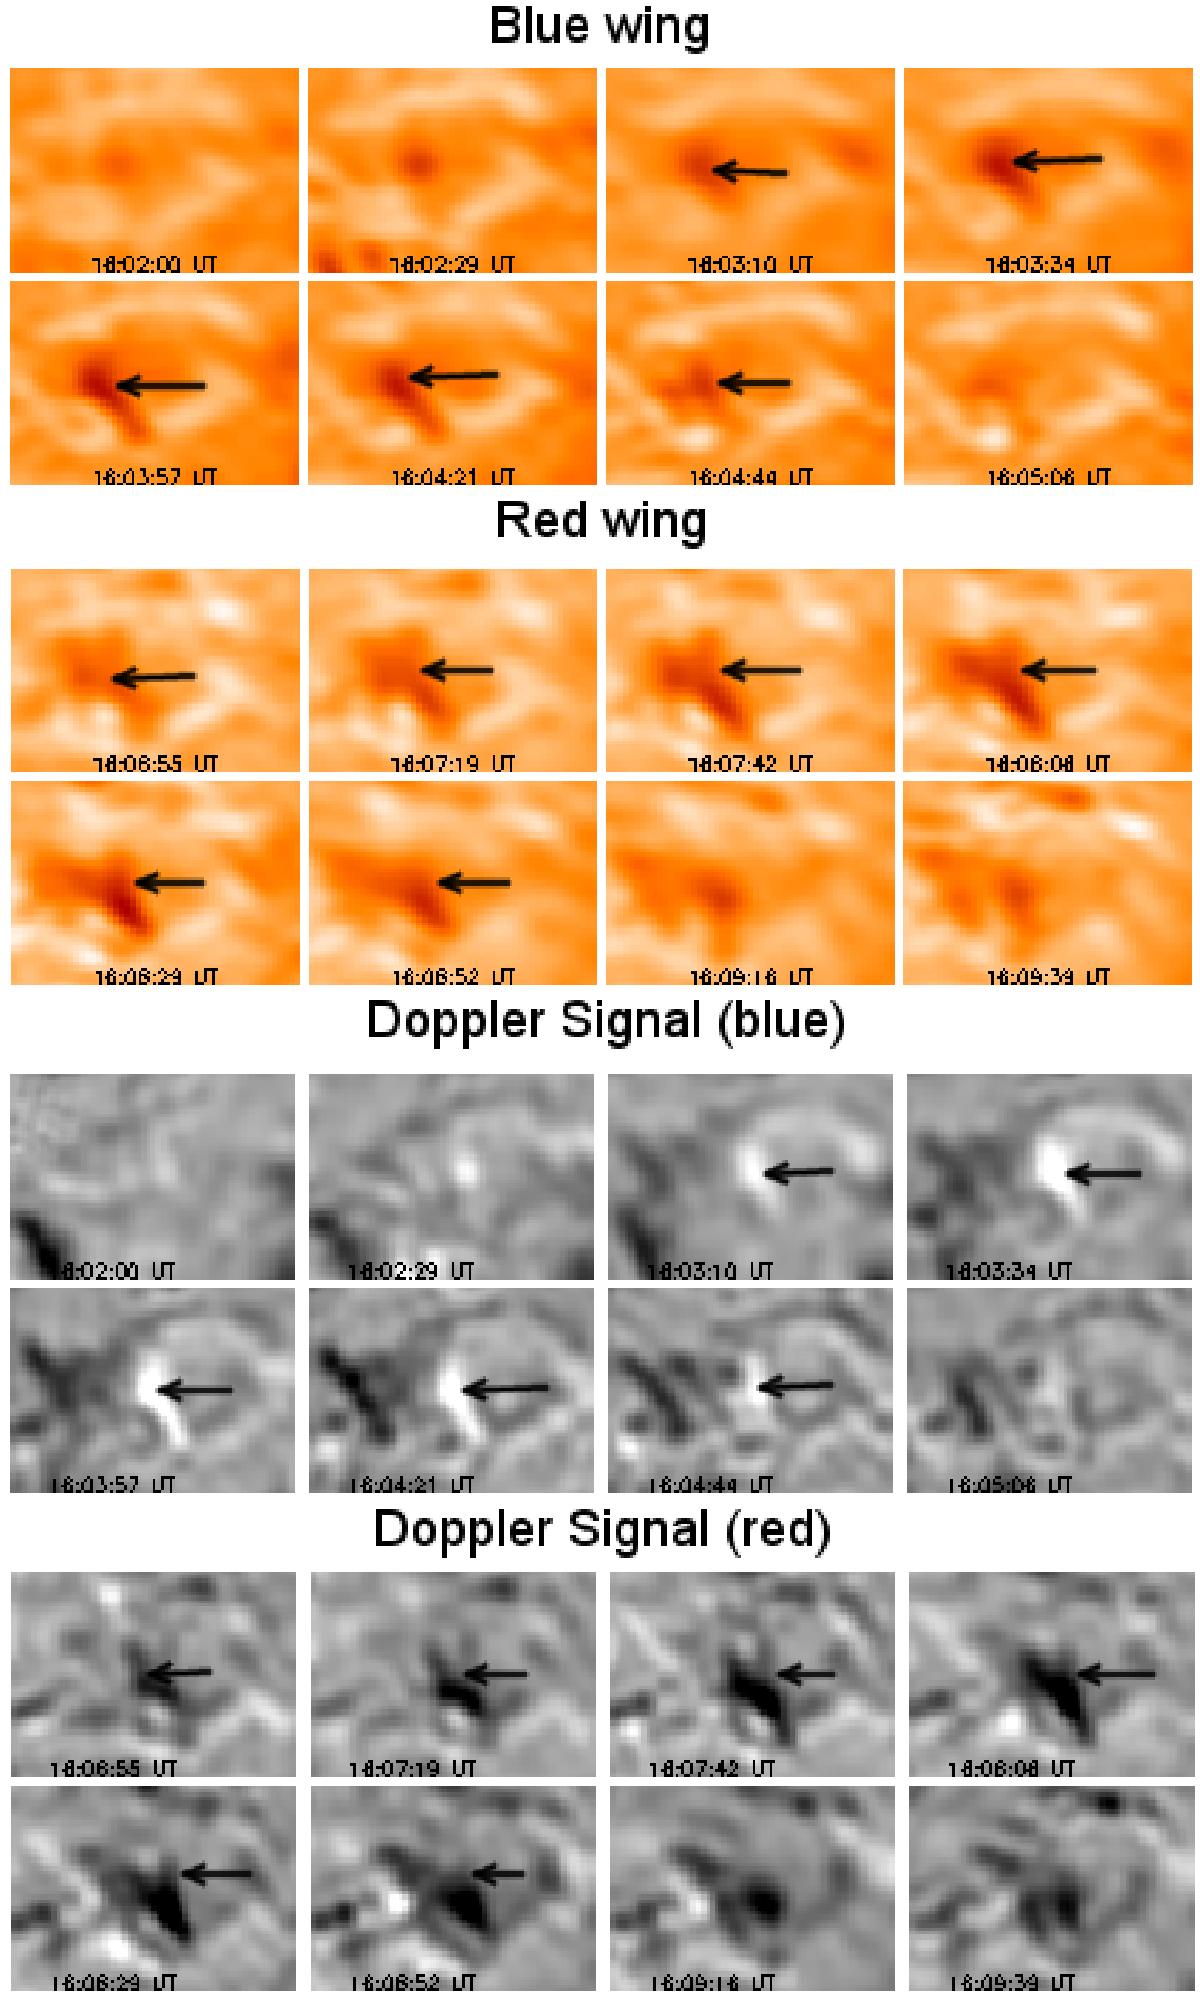
Time evolution of a jet (indicated by an arrow in each panel) in the blue wing of the Hα line (top panels) and in the red wing (second set of panels) and the corresponding DS images (bottom two sets of panels).
This figure is made of several images, please see below:
Current usage metrics show cumulative count of Article Views (full-text article views including HTML views, PDF and ePub downloads, according to the available data) and Abstracts Views on Vision4Press platform.
Data correspond to usage on the plateform after 2015. The current usage metrics is available 48-96 hours after online publication and is updated daily on week days.
Initial download of the metrics may take a while.