Free Access
Fig. 9
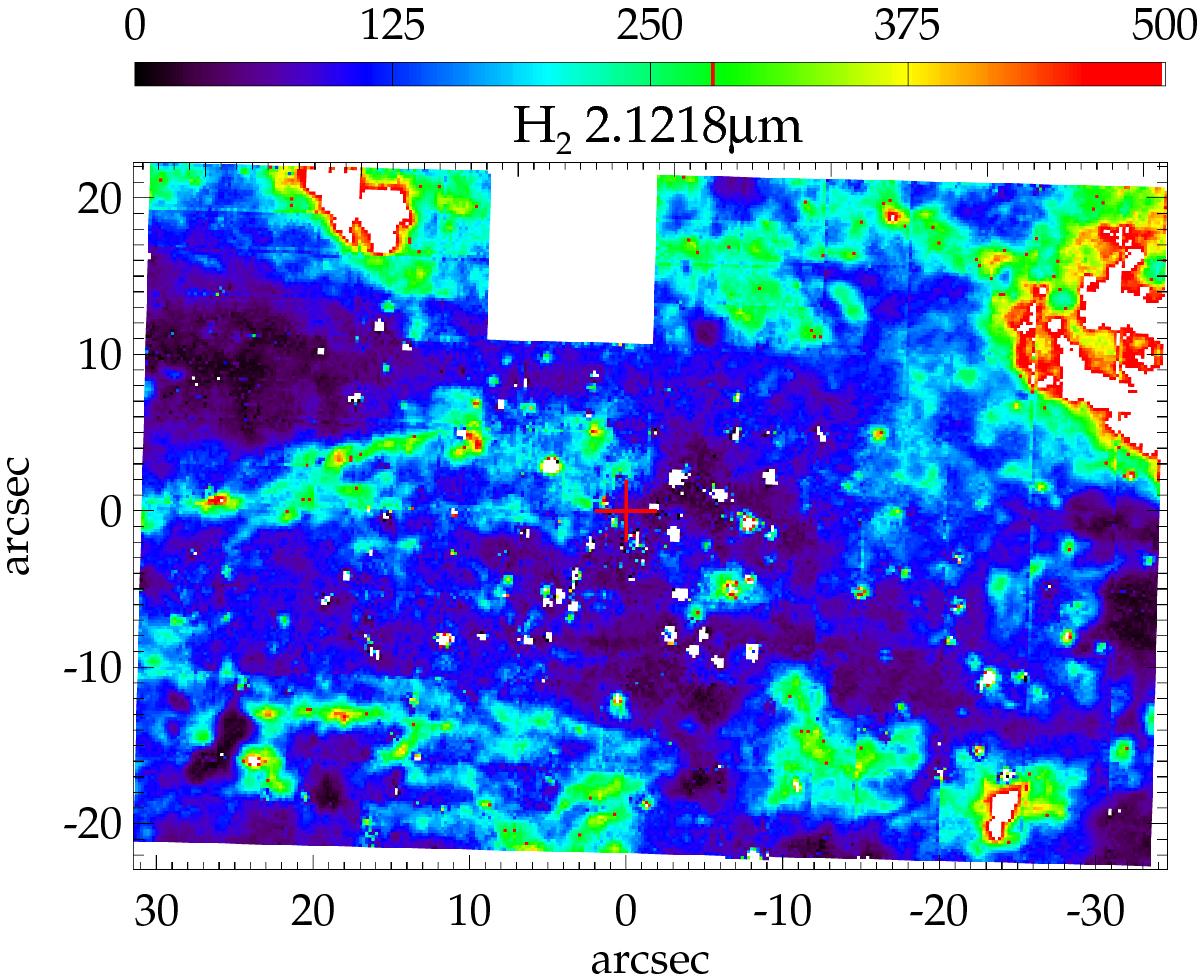
Same as Fig. 7 for H2 gas at 2.1218 μm. The red plus sign denotes the position of Sgr A*. The H2 line flux is not saturated in the data, but we set the scaling in this image low in order to show the extended structure of the gas.
Current usage metrics show cumulative count of Article Views (full-text article views including HTML views, PDF and ePub downloads, according to the available data) and Abstracts Views on Vision4Press platform.
Data correspond to usage on the plateform after 2015. The current usage metrics is available 48-96 hours after online publication and is updated daily on week days.
Initial download of the metrics may take a while.