Fig. 8
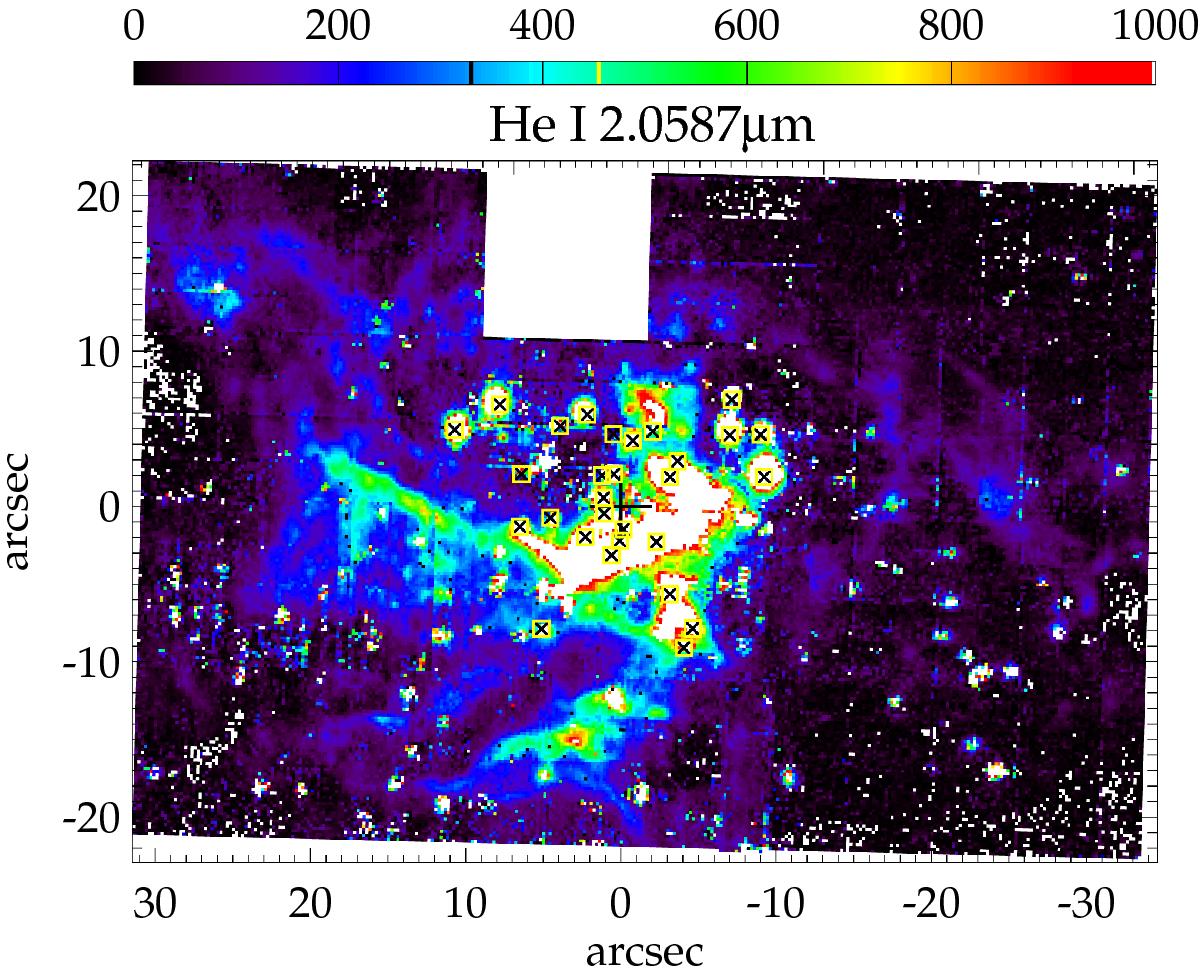
Same as Fig. 7 for He I gas at 2.0587 μm. The black plus sign denotes the position of Sgr A*. The He I emission line is weaker than the Br γ line. Black crosses with yellow surrounding square symbols denote the positions of the emission-line stars (see Sect. 4.2.3). The He I line flux is not saturated in the data, but we set the scaling in this image low in order to show the extended structure of the minispiral.
Current usage metrics show cumulative count of Article Views (full-text article views including HTML views, PDF and ePub downloads, according to the available data) and Abstracts Views on Vision4Press platform.
Data correspond to usage on the plateform after 2015. The current usage metrics is available 48-96 hours after online publication and is updated daily on week days.
Initial download of the metrics may take a while.