Fig. 7
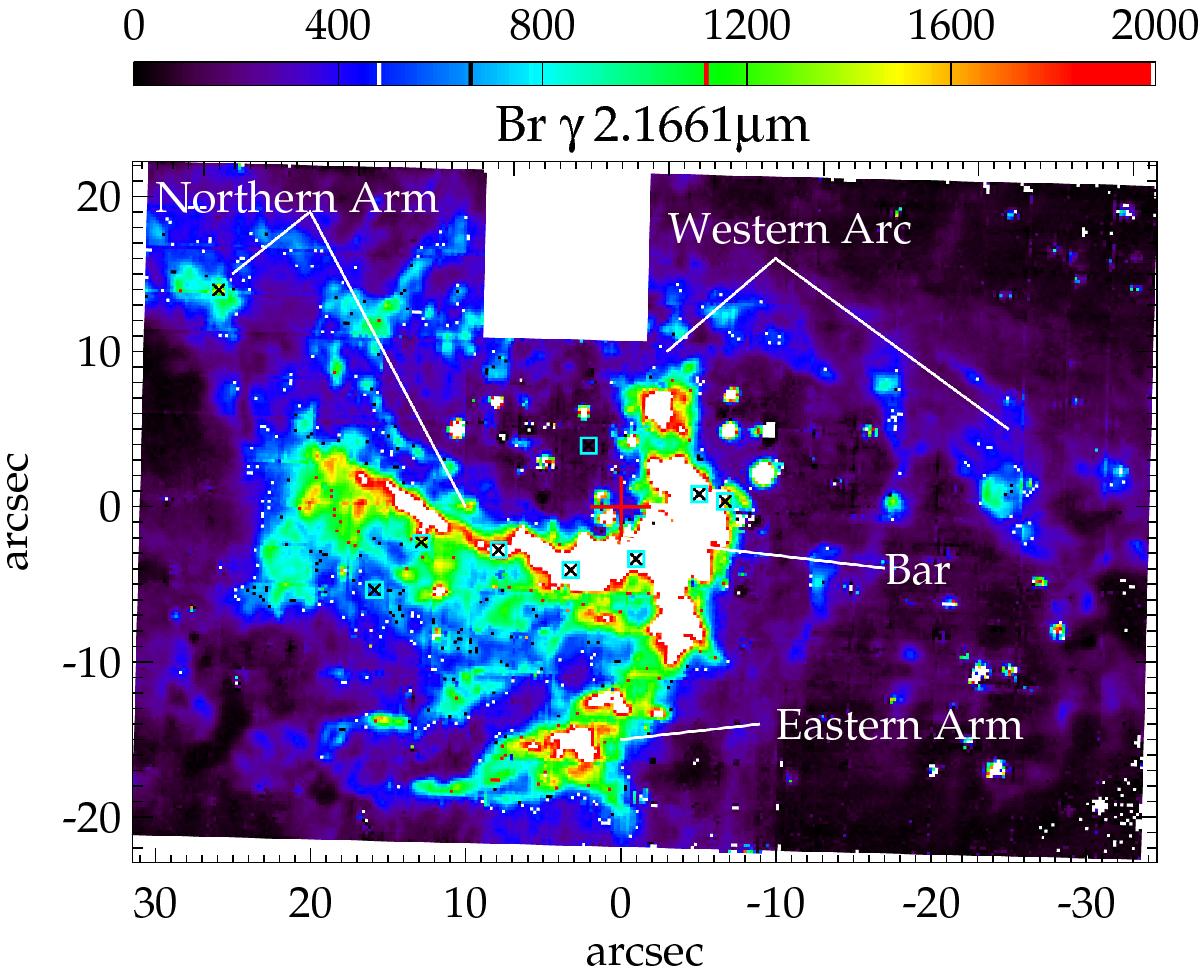
Emission line map of Br γ gas at 2.1661 μm of the full KMOS mosaic. The axes show the distance from Sgr A* (red plus sign) in Galactic coordinates. Black crosses with cyan surrounding square symbols denote the positions of the sources with featureless spectra (see Sect. 4.3). The flux of Br γ emission is not saturated, but the scaling was set low in order to show the fainter, extended structure of the minispiral.
Current usage metrics show cumulative count of Article Views (full-text article views including HTML views, PDF and ePub downloads, according to the available data) and Abstracts Views on Vision4Press platform.
Data correspond to usage on the plateform after 2015. The current usage metrics is available 48-96 hours after online publication and is updated daily on week days.
Initial download of the metrics may take a while.