Fig. 17
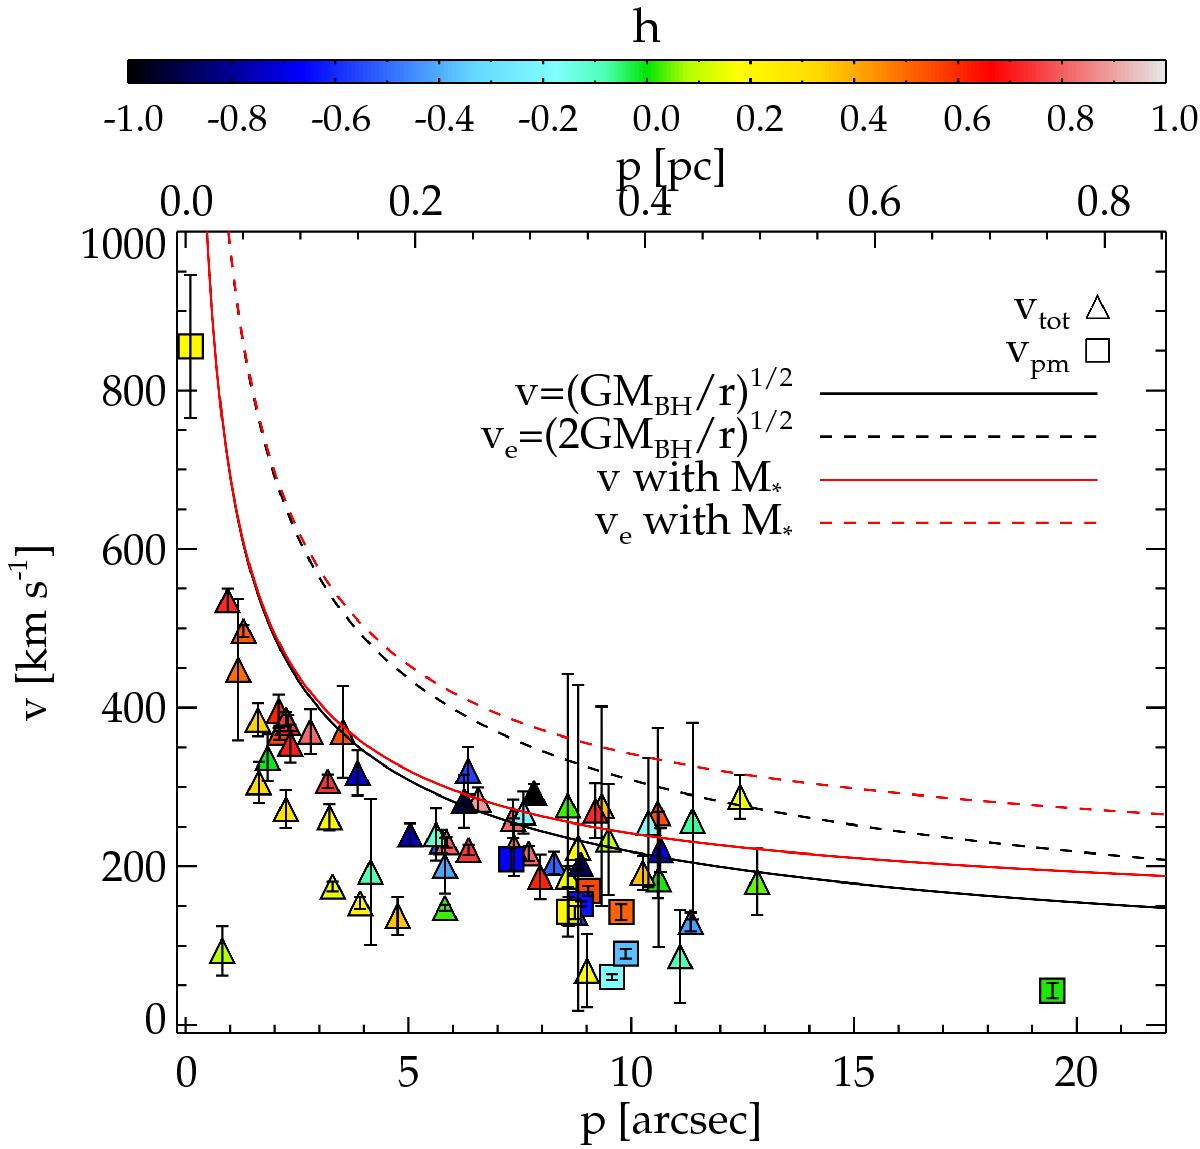
Velocity profile for the O/B stars. The total velocity is plotted against the projected distance p to Sgr A*. Triangles denote fully known kinematics in three dimensions, squares denote only two-dimensional projected proper motion measurements and are therefore only lower limits of the total velocity. The colour-coding illustrates the normalised angular momentum ![]() . The full black line denotes the velocity profile for a central point mass with ℳ• = 4.3 × 10⁶M⊙, the dashed line denotes the escape velocity ve for such a point mass. Red lines mean that we also consider a stellar mass ℳ∗.
. The full black line denotes the velocity profile for a central point mass with ℳ• = 4.3 × 10⁶M⊙, the dashed line denotes the escape velocity ve for such a point mass. Red lines mean that we also consider a stellar mass ℳ∗.
Current usage metrics show cumulative count of Article Views (full-text article views including HTML views, PDF and ePub downloads, according to the available data) and Abstracts Views on Vision4Press platform.
Data correspond to usage on the plateform after 2015. The current usage metrics is available 48-96 hours after online publication and is updated daily on week days.
Initial download of the metrics may take a while.